Demonstration Test of Ocean Current Turbine System for Reliability and Economic Performance Evaluation
DODO Yasush, OCHI Fumitoshi

DODO Yasushi : Manager, Mechatronics & System Engineering Group, Technology Platform Center, Technology & Intelligence Integration
OCHI Fumitoshi : Manager, Project Promotion Group, Technology Planning Department, Technology & Intelligence Integration
The Kuroshio Current along the coast of Japan is one of the strongest ocean currents in the world and is expected to be a stable power source of renewable energy. IHI has worked on the project which is development of a floating-type ocean current turbine system to utilize the Kuroshio Current for power generation, the project was supported by NEDO. We had demonstrated basic concepts of the floating-type ocean current turbine system by 2017. This paper introduces mainly the demonstration test conducted in the actual Kuroshio Current area from 2019 to 2021, and also describes the economic feasibility when this system is used as a source of electricity for remote islands.
1.Introduction
Ocean currents are a marine resource from which a stable supply of energy can be obtained continuously over a long period, relatively unaffected by changes in speed or direction of flow depending on the time of day or season. The Kuroshio Current along the coast of Japan, one of the strongest ocean currents in the world, is therefore a source of renewable energy that is expected to play an important part in providing Japan with energy in the coming years.
As part of a project subsidized by the New Energy and Industrial Technology Development Organization (NEDO), IHI has been developing a floating-type ocean current turbine system for generating electric power by harnessing ocean current energy as shown in Fig. 1. IHI had successfully completed the world’s first demonstration test of actually extracting energy from the Kuroshio Current by 2017 with its newly designed demonstration machine, the KAIRYU(1)–(3). Figure 2 shows a general view of KAIRYU.


Based on the results of the demonstration test by 2017, two tests were conducted: a power generation stability test for more practical, stable power generation, and a Kuroshio Current hovering test designed to evaluate the characteristics by continuously generating power for a certain period of time in the Kuroshio Current area. The results of those tests are introduced in this paper and another paper in this issue of the IHI Engineering Review.
2. Overview of the new demonstration tests
As shown in Fig. 3, using Taniyama Port in Kagoshima Prefecture as the base port, the tests were conducted at a site off the coast of Kuchinoshima (Kuchino Island) in Toshima Village, Kagoshima Prefecture, which has been specified by the Cabinet Office’s National Ocean Policy Secretariat as a demonstration field; a site off the northern coast of Yakushima (Yaku Island); and a site in Kagoshima Bay. The tests were carried out intermittently for about three months from early July to the end of September in 2021, interrupted by typhoon evacuations and port calls for maintenance.

The power generation stability test is conducted to adjust control methods for stable, efficient power generation at different flow velocities. Although this test must be conducted by flexibly varying the flow velocity, it is not possible to arbitrarily control the flow velocity of natural ocean currents. Therefore, the test was carried out by towing the demonstration machine in a sea area having stable flow velocity and varying the towing speed with the aim of simulating ocean currents.
The purpose of the Kuroshio Current hovering test is to perform stable power generation under changing natural ocean current conditions and to estimate the amount of energy that can be harvested from an ocean current turbine system when the project reaches the commercial phase. It was therefore decided to hold the demonstration machine at a fixed point in an actual Kuroshio Current area and to observe the system performance, such as the power generation performance and the stability of the demonstration machine, over a certain period during which the flow velocity of the ocean current changes under the influence of tidal action.
3. Objectives of the new demonstration tests and evaluation of test results
The tests were designed to achieve five objectives.
- (1) Validating the system structure and verifying the long-term reliability of functional components
- The demonstration machine is modified reflecting the 2017 demonstration test results to verify system stability when operated underwater, to estimate the amount of electric power consumed by the built-in components in the area of real ocean, and to verify the long-term reliability of functional components while conducting a post-test open inspection.
- (2) Estimating the capacity factor
- This involves estimation of the capacity factor that can be used as an index for the economic feasibility evaluation after implementing the technology in commercial phase. The capacity factor refers to the value obtained by dividing the amount of electric power actually generated during a certain period by the amount of electric power that could be generated by rated operation during the same period. In the test, the capacity factor is estimated as follows. Multiply the power curve (the relationship between ocean current velocity and output power) of the demonstration machine derived from measurements by the flow velocity in the area of demonstration test, which was separately obtained from year-round measurements, and then subtract the power consumption estimated in (1) above.
- (3) Evaluating the economic justifiability of installation, operation, and maintenance work
- When using ocean equipment, establishing installation and maintenance work methods is important. It is essential to establish a construction method that minimizes the effects of meteorological conditions, especially from the perspective of cost reduction. Therefore, we will compare and evaluate the various construction methods used in the experiments.
- (4) Determining how to facilitate isolated island grid connections
- Renewable energy such as electric power generated using ocean currents is a promising resource, particularly in isolated island environments, which usually depend on diesel engines for power generation. Therefore, this study is conducted to identify the issues and problems associated with connecting an ocean current power generation system to the grid system of an isolated island as well as to work out and evaluate the system configuration requirements to be met for grid connection.
- (5) Evaluating the economic feasibility
- Based on the knowledge obtained in connection with objectives (1) through (4) above, the economic feasibility of ocean current turbine system is evaluated.
Among these objectives, this paper focuses on the first and fifth objectives (i.e., Validating the system structure and verifying the long-term reliability of functional components as well as Evaluating the economic feasibility). The other items are addressed in another paper published in this issue entitled “Evaluation of Power Generation of Ocean Current Turbine System.”
4. Demonstration machine
Figure 4 shows an overview of the demonstration machine KAIRYU. KAIRYU, a power generation system developed specifically for the demonstration test in the area of real ocean conducted in 2017, was designed and built to validate the concept of ocean current power generation. For this reason, the system’s design prioritizes test data acquisition reliability over long-term operability and efficiency, and includes not only redundant control systems but also multiple safety provisions.

The main body (floating body) excluding the turbine blade is equipped with a buoyancy adjustment device for taking in seawater to allow going underwater and an attitude control device for stabilizing the attitude of the body in water by moving hydraulic oil that is stored in three tanks to adjust center of gravity. The main specifications of KAIRYU are summarized below.
- Main specifications of demonstration machine KAIRYU
- Rated output : 100 kW
Rated current velocity : 1.5 m/s
Length and width of main body : approx. 20 × 20 m
Weight : approx. 330 t
Turbine blade diameter : approx. 11 m (assumed to be about 1/3 the size of a commercial version)
In the tests, there was a need to acquire various data necessary to implement a practical system, such as data on long-term performance reliability, energy saving, and maintainability for long-term continuous operation. However, since it was unprecedented to have a mechanical system for rotating a large turbine blade exceeding 10 m in diameter in a natural ocean current environment to obtain a stable supply of energy over a long period, the design of such a system required careful attention.
For these reasons, the original design was reconsidered from the following three perspectives and modified accordingly.
Perspectives for reconsidering the original design:
- A mechanical system as a power generation plant
- A mechanical system as an ocean structure
- A mechanical system that cannot be serviced easily once it begins operation
More specifically, when viewed as a power generation plant, the demonstration machine KAIRYU needed to have maintainability and emergency response features. To that end, the design team visited actual renewable energy power generation plants and asked plant maintenance specialists to identify important maintenance-related considerations.
To develop a perspective from which to reconsider the system as an ocean structure, the design was again reviewed in collaboration with Japan Marine United Corporation. Furthermore, with the cooperation of the person in charge of the Epsilon rocket of IHI Aerospace Co., Ltd., to reconsider the system as a mechanical system that cannot be serviced easily once it begins operation, we conducted functional validations in advance, risk assessment of failure, and consideration of countermeasures. As a result, necessary data was successfully obtained by overcoming various problems expected at real ocean sites through demonstration tests. Figure 5 shows how the demonstration test was conducted.

5. Configuration of the demonstration test fleet
The tests required attitude control checks and measurement of power generation characteristics under various flow velocity conditions. It was also necessary to move from one test site to another quickly to observe the flow velocity characteristics at a number of sites in the Kuroshio Current area. For these reasons, although the concept of the system was to moor the demonstration machine to the seafloor for power generation, the test was conducted by mooring the demonstration machine to a sinker suspended from a barge at a water depth of about 100 m and towing the entire setup in order to simulate KAIRYU floating in the ocean current as shown in Fig. 6.

The demonstration machine was controlled from a control station set up on the barge, and the generated electric power was measured by conveying it onto the barge through a power cable installed alongside the mooring cables. During the power generation stability test, the position and speed of the barge were controlled by the tugboat ahead of the barge. In the Kuroshio Current hovering test, the barge was tracked by GPS to keep the barge at a fixed point in the ocean current.
6. Verifying the long-term reliability of functional components
Various results were obtained from the tests, including power curves of the demonstration machine in the actual Kuroshio Current. This paper focuses on and explains the strength evaluation of the floating body conducted to verify the long-term reliability of functional components.
With the aim of validating the strength evaluation of the demonstration machine’s floating body conducted during the design stage, strain sensors were installed at various locations. In particular, the floating structure’s aft section, where the turbine blades are installed, was instrumented as follows: strain sensors were installed on the top, bottom, and sides of the left and right pods to measure bending loads and tensile loads acting on the aft section by turbine blades(4). Figure 7 shows the internal structure of the aft section instrumented with strain sensors.

Figure 8 shows the change over time in circumferential stress calculated from the values obtained by the strain sensors installed in the strain sensor installation zone on the right pod. Because the evaluation targets the strength of the floating structure, the time shown on the horizontal axis starts from the point at which the floating structure is lifted by the crane (i.e., when the maximum stress occurs) to the point at which it is lowered into the sea and completely submerged.

Because measurement began while the demonstration machine was already being lifted as shown in Fig. 9, none of the stress values started from zero. The bottom-of-circumference stress, however, alone shows significantly larger negative values. This may in part be because of circumferential compressive stress due to the sling used for lifting, but it may also be because pod strains due to temperature changes were detected in view of the fact that there were differences in atmospheric temperature and environmental conditions between the day of strain sensor installation and the day of measurement.

It can also be seen that the compressive stress at the bottom began to increase immediately after landing on the water. The amount of change that occurred until the maximum depth was reached was about 4.2 MPa, and it is close to 4.47 MPa, which is the hoop stress (circumferential stress acting on a cylindrical shell) simply calculated from the external pressure at the water depth (5.7 m) reached by the bottom of the pod. Similarly, the stress on the left and right sides also changed to the compression direction, but the slope of the graph at the beginning of change — i.e., the time rate of change in stress — exhibits significantly different values on the right and left sides. This is thought to be because the right pod is hung diagonally on the upper left by the lifting sling, and there is a difference in how the load is released after landing on the water. However, the measured amount of change that occurred until the maximum water depth was reached was about 3.0 MPa, which is close to the calculated value of 3.29 MPa.
Unlike the other graphs, the graph of the top-of-circumference stress shows slight changes to the tension side until point A is reached. Similarly, this is also thought to be because the tightening due to the lifting sling is reduced after landing on the water, but the difference is thought to be attributable to the fact that it took longer for the top-of-circumference strain sensor than the other strain sensors to be submerged.
Various other load cases assumed in the design stage were also examined, but in all cases, the measured stresses were sufficiently smaller than the assumed values. This indicates that there are no problems with the design method.
7. Economic performance evaluation
The cost of a case assuming the use of an ocean current turbine system to supply electric power to an isolated island was calculated. The conditions for such cost calculation were as follows.
Conditions for cost calculation
- Recipient of electric power : Tanegashima
- Scale of power generation : 10 MW (2 MW/unit × 5 units)
- Operation period : 20 years
In preparation for selecting an area in which to install the ocean current turbine system, a distribution map of ocean current velocity was prepared through ocean current simulation as shown in Fig. 10, and an area with high average flow velocity (i.e., an area with strong ocean currents) was selected. Power generation output was estimated by applying the power curves derived from the test data to the time history of the flow velocity in the selected area. The estimated capacity factor thus obtained was 43% (including downtime for maintenance).

For this output estimate, CAPEX (capital expenditures: expenditures for investment in equipment) and OPEX (operating expenses: expenses for operation) were estimated for the assumed operation period of 20 years, and the power generation cost was calculated accordingly. The power generation cost thus obtained was about 56.5 yen/kWh. The power generation cost corresponding to the assumed scale of the equipment was estimated to be about 3 000 000 yen/kW, as shown in Fig. 11.

This power generation cost is likely to be higher than the power generation costs of other sources of renewable energy such as photovoltaic power generation. As for the breakdown, OPEX accounts for about 25%, while CAPEX accounts for about 75%.
The manufacturing cost of the ocean current turbine system is around 50%, while about 40% are expenses for marine construction work and subsea cable installation. The costs of marine construction work and subsea cable installation can be expected to fall in the future because the technologies used in such types of work are similar in many ways to the technologies used in ongoing offshore wind turbine construction projects.
8. Future issue and problem
8.1 Enhancing ocean current simulation accuracy and accumulating measurement data
Using ocean simulation technology, various improvements are enhancing ocean current estimation accuracy. If the feasibility of ocean current power generation is to be reliably estimated, however, further accuracy enhancement is necessary.
For example, in connection with the spatial resolution and time scale used for ocean current simulation in the field of oceanography, it is necessary to establish a technique for predicting short-term (several days), medium-term (up to several months), and long-term (years up to the entire operation period) ocean current regimes at the spatial resolution (0.1 to 0.2 km) required for a siting study for an ocean current power generation project.
Enhancing estimation accuracy requires verifying the validity of simulation models, improving models using measurement data, and accumulating data on the current characteristics of various sea areas. To this end, it is effective and important to accumulate oceanographic measurement data on characteristics such as current velocity as well as submarine topography and geology.
Important steps toward practical ocean current power generation are to search for sea areas that are suitable for ocean current power generation (those with high current velocity, small temporal and spatial fluctuations, short offshore distances, and shallow water depth) and to gain a deeper understanding of the characteristics of ocean currents as an ocean energy resource.
8.2 Long-term power output fluctuation characteristics
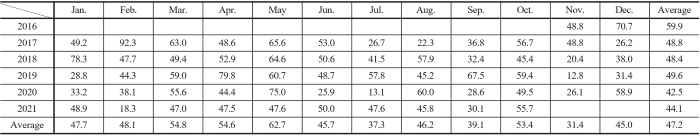
Although ocean currents move in defined directions, their velocities change seasonally. Figure 12 shows the velocities of an ocean current and the estimated power outputs for five years from an ocean current turbine system installed in said current, along with examples of five-year, one-year, and one-month data. Current velocities are shown in blue, while capacity factors are shown in yellow. The capacity factor is equivalent to the power output, and a capacity factor of 100% means that the ocean current turbine system is being operated to capacity.
Figure 12 shows that there are fast-current periods and slow-current periods, and that there are weeks during which the capacity factor is nearly 100% as well as weeks during which it falls to nearly 0%. Overall, the annual capacity factor exceeds 40%.

Fluctuations in power output are thought to be attributable to changes in the flow rate and flow axis of the Kuroshio Current in the Tokara Strait area. The accurate prediction of such short-, medium-, and long-term fluctuations so that power generation can be planned accordingly is important for realizing economically feasible ocean current power generation.
Table 1 shows the monthly capacity factor calculation results based on predictions of such fluctuations in current velocity. As shown, the capacity factor ranges widely from the highest value of 92.3% in one month to the lowest of 12.8% in another. The predictions thus obtained indicate that the capacity factor tends to be high from March to May and low in November and December. These predictions were obtained through simulation. Since higher estimation accuracy leads to the more reliable evaluation of power generation feasibility, further accuracy enhancement is desirable.
8.3 Development of marine construction technologies
If a floating-type ocean current turbine system is to be put to practical use, in order to facilitate offshore installation and maintenance in the Kuroshio Current area, it is essential to refine the mooring systems consisting of mooring cables, dynamic cables, anchors, and the like as well as to introduce underwater power transmission equipment such as connectors that can be attached and detached in water.
To facilitate offshore installation and maintenance in the Kuroshio Current area, in addition to mooring systems, it is also necessary to refine marine construction technology, as illustrated in Fig. 13. More specifically, there is a need to use larger equipment and to enhance the level of safety of offshore work processes. By doing so, offshore activities can be implemented even under non-calm oceanographic conditions so as to increase the working-day ratio (the ratio of the number of workable days), thereby enhancing economic feasibility.

The goal of refining offshore activities is to make it possible to carry out construction work even when the significant wave height is 1.5 m or more. The significant wave height is the average height of the largest 1/3 of waves among the count of continuously observed waves. Because the significant height of 1.5 m is a considerably violent phenomenon, by achieving this goal, the working day ratio of offshore construction work can be increased to 60% or higher. This will also make it easier to schedule offshore construction activities, such as installing mooring systems and connecting and disconnecting floating structures to such mooring systems.
It is necessary to develop a construction method that can complete the connection work and disconnection work of the floating structure in a single day at an offshore site. Technologies expected to be used for this construction method include dynamic positioning (DP), knuckle cranes, mooring point detachment manipulators, and remotely operated vehicles (ROVs). These technologies are believed to enable connection and disconnection work for large-scale ocean current power generation systems. It is also important to realize a diverless construction process for safe construction at offshore. The use of DP, knuckle cranes, mooring point detachment manipulators, and ROVs is considered to contribute to the realization of diverless. Alongside these technologies, it is also necessary to establish technologies for achieving a higher level of safety by means of diverless operation and mitigating the adverse effects of oceanographic phenomena on the working day ratio.
9. Conclusion
This paper has briefly reported on an ocean current turbine demonstration test and the economic feasibility evaluation carried out based on the test results. It can be concluded that, despite that there are various issues to be resolved, generating electric power from the energy of ocean currents using the system reported in this paper is a feasible goal. As mentioned in the other paper published in this issue, we evaluated the capacity factor of the power generation system and its power output fluctuations connected to an isolated island grid and we believe that the system can be put to practical use in the future. However, for practical use, it is necessary to reduce the power generation costs associated with installation and operation, such as the offshore construction costs. We will continue to evaluate the feasibility of ocean current power generation, paying attention to ongoing cost reduction efforts achieved through the progress of offshore wind power generation and other projects in Japan.
- — Acknowledgments —
- The demonstration test was conducted as part of a project subsidized by the New Energy and Industrial Technology Development Organization (NEDO). The authors would like to express their appreciation for NEDO’s generous cooperation in connection with the test. The authors are particularly grateful to Dr. Kyoji Kamemoto, Professor Emeritus of Yokohama National University and the chair of the research evaluation committee, for his generous guidance.
REFERENCES
- Y. Dodo et.al.:Development and design of a floating type ocean current turbine system,Practical Design of Ships and Other Floating Structures, (2019), pp. 732-755
- IHI Corporation : IHI Demonstrated the World’s Largest Ocean Current Turbine for the First Time in the World, IHI Engineering Review, Vol. 52, No. 1, 2019
- M. Shimizu, S. Nagaya, T. Ueno, H. Saito, S. Murata and A. Ito:Development and Demonstration test for Floating Type Ocean Current Turbine System conducted in KUROSHIO CURRENT,Grand Renewable Energy 2018, Japan council for Renewable Energy, (2018), p. 239
- Y. Dodo, T. Okada, S. Nagaya and Y. Ishiguro : Stress Measurement and Evaluation of Ocean Current Power Generating Pods in Field Demonstration Tests, Proceedings of the Conference of the Japan Society of Naval Architects and Ocean Engineers, No. 34, 2022, pp. 563-565 (in Japanese)