Congestion Control on Conveyor Lines with Deep Reinforcement Learning and Bayesian Optimization
TAKAHASHI Kengo, SHIKAYAMA Hiroyuki
TAKAHASHI Kengo : Electrical & Control Design Group, Project Department, Logistics System Business Unit, IHI Logistics & Machinery Corporation
SHIKAYAMA Hiroyuki : Manager, Electrical & Control Design Group, Project Department, Logistics System Business Unit, IHI Logistics & Machinery Corporation
The characteristics of congestion control on conveyor lines cause difficulty in handling the control with classical control theories. In this study, we addressed it by combining deep reinforcement learning with Bayesian optimization, a method for optimizing parameters. The agent trained with our method successfully controlled the congestion on the conveyor line and outperformed the classical PI control. This method, which is less dependent on the designer, is expected to provide customers with added value such as reduction of person-hours and lead-time, and improvement in energy efficiency of their equipment.
1. Introduction
Classical control theories, which were structured in the 1950s, are still a key approach to operating industrial equipment today. PID (Proportional Integral Differential) control is one of the most commonly used types of feedback control among classical control theories and is a control method for determining the input value based on the difference between the current output value and target value, its time integral, and its time derivative. This method is easy to handle with clear meanings of parameters, but in order to determine the input value, the control designer is required to learn by trial and error or deepen their understanding of problems based on their experience and intuition. In addition, PID control is also difficult to apply to certain types of problems.
One such problem is workpiece congestion control on conveyor lines in logistics systems. Congestion on conveyor lines causes an event called a “drop,” which hinders the loading of new workpieces (for details, see Section 2.1). Drops should be avoided because they will lead mainly to reduced transportation efficiency, but they cannot easily be prevented by controlling them themselves. This is because, for example, when follow-up control is used, the control works to prevent drops after a drop occurs, which means that drops cannot be avoided in principle. Therefore, in order to avoid congestion on conveyor lines, which is a factor causing a drop, it is necessary to control how workpieces are distributed. With classical control theories, however, it is difficult to handle such distribution directly. For example, with the previously-mentioned PID control, there is a need to obtain the difference between the current output value and target value, but the difference in distribution cannot easily be defined. In addition, the target distribution itself is not always known in advance.
In this study, we worked on optimization for controlling conveyor lines with little human intervention by combining deep reinforcement learning, which applies deep learning to reinforcement learning, and Bayesian optimization, which is an optimization method. Neural networks, which are used in deep reinforcement learning, enable direct handling of distribution on conveyor lines, and in addition, enable the creation of control logics less dependent on designers when combined with Bayesian optimization.
IHI Logistics & Machinery Corporation has been engaged in developments that contribute to streamlining, automation, and labor savings of customers’ equipment, including the automation of piece picking and assorting work with robots and deployment of image recognition AI (Artificial Intelligence) for depalletizing systems. This study constitutes part of such development and is aimed at offering customers added value by taking advantage of the features of deep reinforcement learning, including reducing person-hours and lead time and operating equipment with higher energy efficiency than before.
2. Implementation method
2.1 Conveyor line model
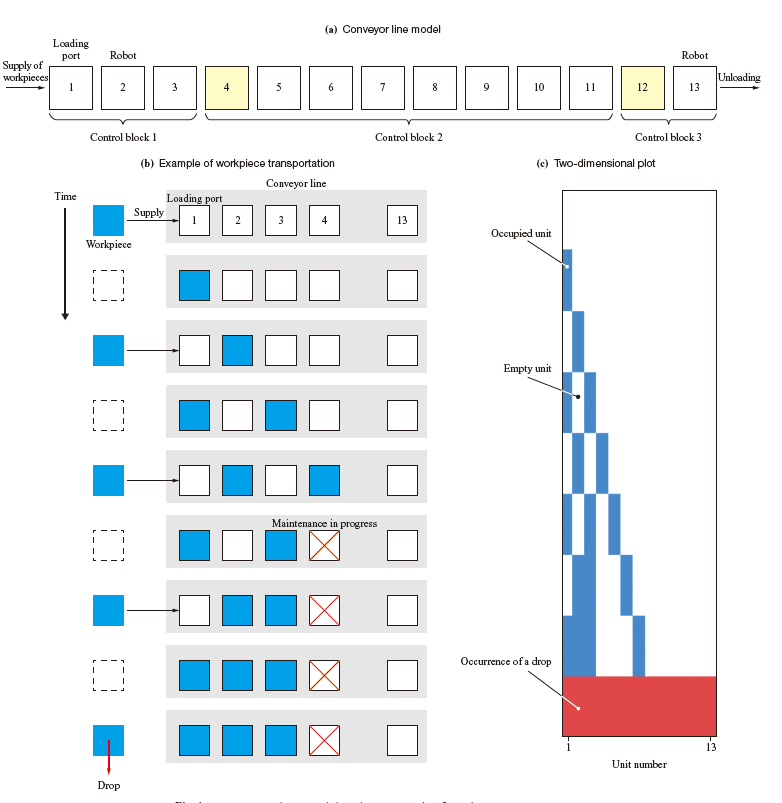
Figure 1 shows a conveyor line model and an example of workpiece transportation. In this study, a conveyor line shown in Fig. 1-(a) is configured in simulation. The squares (units) arranged in one line indicate the stop positions of individual workpieces and the distance between the centers of neighboring units is 1 m. Workpieces are supplied, one by one, into the loading port at certain intervals T(s) , conveyed from one unit to another toward the downstream side, and unloaded by a robot at the most downstream position. Multiple workpieces cannot be put in one unit at the same time. Colored units 4 and 12 start counting 60 s each time L4,L12 workpieces are conveyed. When the units become empty after 60 s are counted, the units transition to maintenance state with time lengths of M4, M12(s) . No workpieces are conveyed to the units that have transitioned to the maintenance state.
Figure 1-(b) shows an example of time history of workpiece transportation. As shown in the figure, once a unit transitions to the maintenance state, the transportation of workpieces stops in the upstream side of the unit, causing congestion. If the congestion reaches the most upstream position, the unit at the loading port is occupied, and no new workpieces can be supplied. In this study, such an event is referred to as a “drop.”
The time history of workpiece transportation shown in Fig. 1-(b) is plotted in two dimensions as shown in Fig. 1-(c). The horizontal axis indicates the unit number on the conveyor line and the vertical axis indicates the time flow from top to bottom.
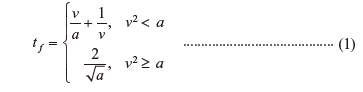
Each unit can be instructed to operate at a speed ν (m/s) of 0 to νmax . As shown in Equation, the time tf (s) — the time from when a unit receives a workpiece to when the workpiece is conveyed to the next unit on the downstream side — is determined based on the v and the specified acceleration a a (> 0) (m/s²) for each unit.
In the model used in this study, the conveyor line is roughly divided into three control blocks (Fig. 1-(a)), and the units belonging to the same block are instructed to operate at the same speed. This means that only three different instruction speeds are necessary to control all the control blocks.
The simplest control measure to prevent drops is to operate all the units at the maximum transportation speeds. In this case, however, the units operate at the maximum speeds even when there is no congestion on the conveyor line. Transportation at speeds higher than necessary wastes energy and causes a risk of damage to workpieces. Therefore, this study is aimed at minimizing drops on the conveyor line while reducing the transportation speed.
2.2 Deep reinforcement learning
2.2.1 Overview
There is an agent in a certain environment. The agent can determine its action based on the environmental state and the environment gives the agent a value called a reward according to the result of the action. Reinforcement learning is a machine learning method to consider what action the agent should take to maximize the total reward (return) when handling a problem in such a framework.
Q-learning is a representative algorithm for reinforcement learning. The purpose of Q-learning is to obtain the expected return value (when the best action is taken) for all combinations of environmental states and agent’s actions. This procedure is equivalent to creating a table of expected values where the column and row indicate environmental states and agent’s actions, respectively. Once such a table can be obtained, each time a state is given to a model, the best action can be obtained by tracing the column corresponding to that state and selecting the action with the highest expected value.
However, it is difficult to apply this method to problems having many environmental states and actions to select. This is because handling such a problem requires creating a table consisting of many columns and rows, but too large a table cannot be stored in the memory space of the compute(1). In the case of the game of Go, for example, there are said to be nearly 10172 possible states on the board. Even if one board state can be represented by one byte, a memory space of 10160 TB is required to create one column in the table. In addition, Q-learning cannot be applied for problems whose states and actions are represented with continuous values.
Therefore, the methods using a neural network as a function approximato(2) have been attracting attention in recent years. Generally, using a neural network guarantees that a complicated function can be approximated with even a simple structure (Universal Approximation Theorem). Using this advantage, these methods approximately obtain a function to output the expected value based on the state and action, and a function to output the optimal action directly based on the environmental state, omitting the process of obtaining the expected value. These methods can handle problems without creating tables and do not require a large memory space. In addition, they can handle states and actions represented with consecutive values. Many of the methods using a neural network are also more advantageous in terms of calculation time than Q-learning. This is because the optimal parameters for approximating a function can be obtained effectively by using backpropagation and a general-purpose GPU (Graphics Processing Unit). In particular, the method that incorporates neural networks (deep learning) into reinforcement learning is referred to as deep reinforcement learning.
2.2.2 Application to logistics transportation problems
As described in Subsection 2.2.1, handling a problem by reinforcement learning requires defining an environment and its state, an agent and its action, and a reward calculation method. In this study, they are defined as follows.
(1) Environment and its state
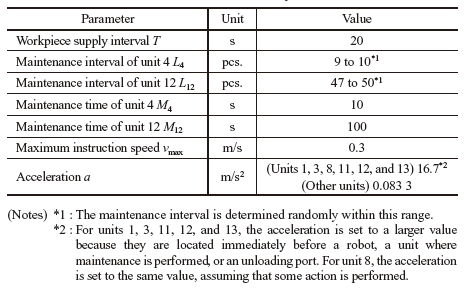
To define an environment, the conveyor line model described in Section 2.1 is used. Table 1 shows the parameters for the conveyor line model. The environmental state is defined as a 19-dimensional vector consisting of the following elements:
- Presence flags for units 1 to 13 on the conveyor line
- Countdown values of units 4 and 12
- Elapsed time of maintenance of units 4 and 12
- Flag for indicating whether or not unit 4 or 12 is under maintenance state
(2) Agent and its action
In this study, PPO (Proximal Policy Optimization)(3) is adopted as an optimization algorithm for the agent. With this method, the agent has two neural networks, a critic network and an actor network, in it and works to optimize them simultaneously.
These networks receive the above-mentioned state vector as an input. The critic network sends an estimated return value as an output, and the actor network sends three different speed instruction values to control blocks 1 to 3. The estimated return value is used later to update the network parameters. These speed instruction values correspond to the action passed from the agent to the environment.
(3) Reward calculation method
The variable that takes 1 or 0 depending on whether or not a workpiece is conveyed to the most downstream position at a certain point of time t is xt,catch, the variable indicates whether or not a workpiece drop has occurred is xt,drop, and the speed instruction given to i -th unit is νt, i (i = 1 to 13). The reward rt at time t is defined by Equation(2).
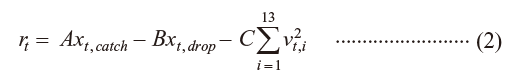
Coefficients A,B,C (> 0) are hyperparameters.
The reward is designed as above for the following reason. The first term in Equation indicates the positive reward given each time a workpiece can be conveyed, and this is necessary to ensure that the conveyor line model created in this study acts correctly as a conveyor line. This study is intended to develop controls that minimize the number of drops and at the same time reduce the operation speed (energy consumption). For this purpose, the second term gives a negative reward each time a drop occurs, and the third term gives a greater negative reward as the operation speed is increased.
2.2.3 Process flow of learning
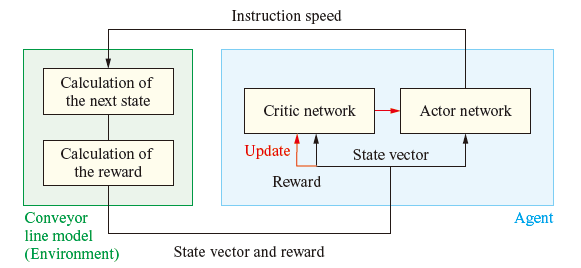
Figure 2 is a flowchart of deep reinforcement learning on a conveyor line.
First, the neural networks in the agent and the conveyor line model are initialized appropriately. Then, the initial state of the conveyor line is given to the agent, and based on the received information, the agent calculates the estimated return value and speed instruction values with the neural networks. The speed instruction values are passed to the conveyor line model as an action. Based on these values, the conveyor line model calculates the state after the unit time has passed, and then calculates the reward accompanying the change in the state. The calculated state and reward are returned to the agent.
Each time this transaction is repeated a certain number of times, the critic and actor network parameters are updated according to the PPO algorithm. This procedure is repeated until the optimal networks are obtained.
2.2.4 Evaluation
The trained agent is evaluated based on the number of drops and average maximum speed value ū when the conveyor line model is operated for one hour by simulation. The average maximum speed value ū is defined in Equation(3) below.
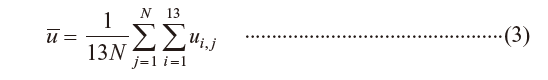
where N is the total number of workpieces supplied when the model is operated for one hour, suffix j is used to identify each workpiece and is assigned, as 1, 2, 3, ...,…,N , to the workpieces in the order they are supplied from the start of simulation, and ui, j indicates the maximum speed at which workpiece j passes the i -th unit.
The number of drops should be as small as possible, and if there are agents that occur the same number of drops, a controller that operates at a lower average maximum speed is superior.
2.3 Bayesian optimization
To operate the conveyor line appropriately, it is necessary to set the reward parameters A, B, and C in Equation appropriately. One extreme example is that, if the first term and second term are far greater than the third term, the reward that the agent can obtain by minimizing the speed is extremely small and the agent may be trained so that it always instructs each unit to operate at the maximum speed. Conversely, if the third term is far greater than the first term and second term, the reward obtained by conveying the workpieces or reducing the number of drops is greater than the penalty (negative reward) incurred by increasing the speed, and as a result, the agent may decide not to convey workpieces.
Since the A, B, and C values required to achieve the desired operation are unknown, there is a need to try many values. In general, deep reinforcement learning requires a large time cost, and it is desirable to find good parameters with as few attempts as possible.
Therefore, this study used Bayesian optimization, which is an optimization method. With Bayesian optimization, the maximum value (or the minimum value) of a function whose shape is unknown can be obtained efficiently. For example, a one-dimensional function f (x) is optimized by the iterative calculation below(4).
- First, determine x randomly.
- For the x determined previously, check the f (x) value and hold the set of (x, f (x)) as data.
- Create a statistical model for predicting the shape of f (x) based on the data obtained so far.
- Using the statistical model, determine the x to check next.
- Go back to step(2).
In this study, the parameters were determined by replacing A, B, and C , and function f (x) with the “performance of the agent obtained by deep reinforcement learning with A, B, and C fixed at certain values” before performing the above procedure.
3. Results
3.1 Training the agent
Figure 3 shows a typical learning curve of the agent. From this figure, it can be seen that the return increases as the number of agent training steps increases, showing stable progress of agent training.
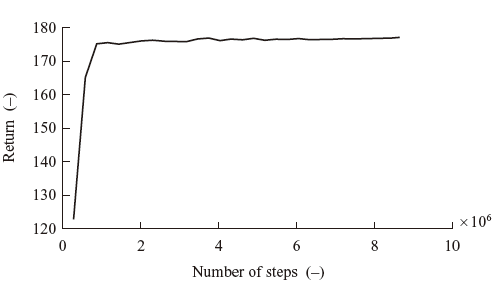
Figure 4 compares the conveyor line control between the untrained agent and trained agent. The time history of workpiece transportation for 30 minutes is plotted in two dimensions. With the untrained agent, the workpieces were not conveyed smoothly, causing many drops. With the trained agent, the workpieces were conveyed smoothly, and no drops occurred.
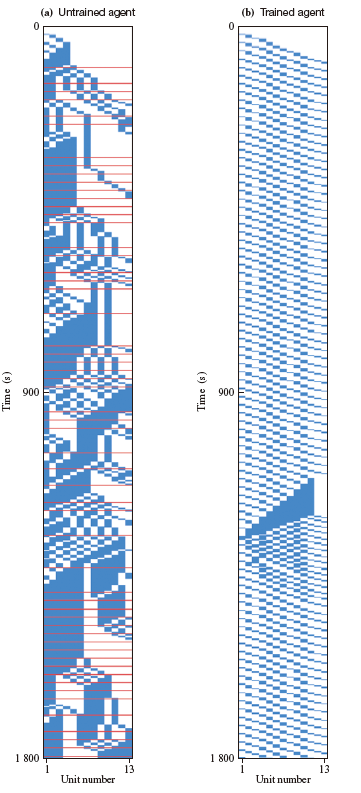
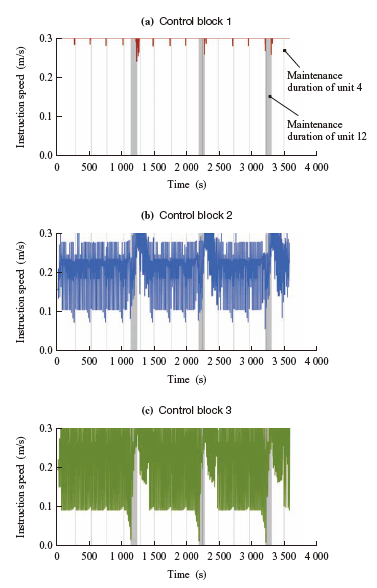
Figure 5 shows how the instruction speed of the trained agent changed with time. The time elapsed is plotted for one hour. The three graphs in Figs. 5-(a) to (c) correspond to control blocks 1 to 3, and the gray areas in the graphs indicate the duration in which maintenance is in progress in unit 4 or 12. These graphs suggest that the agent adjusts the instruction speed before and after maintenance when congestion is likely to occur, thereby achieving efficient workpiece transportation while avoiding drops.
3.2 Comparison with PI control
To examine the performance of deep reinforcement learning, we simulated conveyor line control using the PI (Proportional Integral) control, which is PID control without time derivatives. At this time, PI control was configured so that the occupancy rate is a controlled variable based on the knowledge from the studies of congestio(5) that congestion occurs when the occupancy rate exceeds 50%. Figure 6 shows the block diagram of PI control on a conveyor line.
Even with PI control, workpiece drops could be eliminated completely, but the average maximum speed was 0.270 m/s. With the agent trained by deep reinforcement learning, the average maximum speed was 0.257 m/s, and deep reinforcement learning is superior in terms of transportation speed.
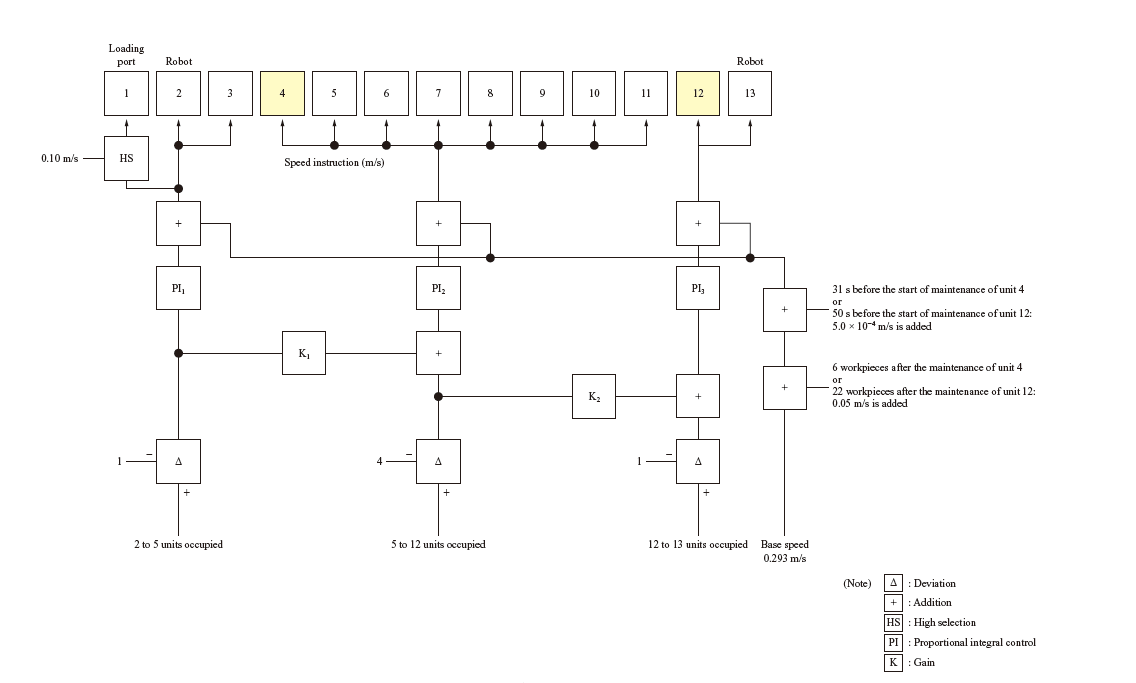
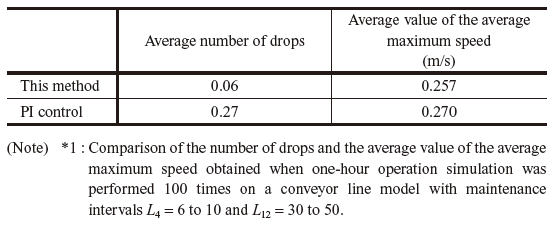
Table 2 shows comparison of performance between this method and PI control with an environment different than that used for the training. This is intended to examine how much the two controllers can address an unknown environment. With deep reinforcement learning, compared with PI control, the average number of drops could successfully be reduced to 1/4.5 with a reduced average maximum speed. This result shows a difference in robustness against parameter fluctuations between deep reinforcement learning and PI control.
Table 2 Performance comparison between this method and PI control with different parameters from those used for training*1
4. Conclusion
To solve the congestion control problem on conveyor lines, which cannot be handled with classical control theories, we developed a control logic that minimizes both the number of drops and the operation speed by using deep reinforcement learning and Bayesian optimization.
By adopting a method called PPO as an algorithm for deep reinforcement learning and using Bayesian optimization for adjusting the parameters, we successfully achieved stable agent training without human intervention. We simulated a conveyor line with a trained agent, where drops could be completely eliminated and the energy efficiency exceeded the result obtained by PI control. The simulation also found that the controller obtained by deep reinforcement learning is more robust against changes in the environment. This suggests that with this method, it is easier to readjust parameters when the same logic is reused.
Judging from these results, this method is expected to offer customers added value such as reducing person-hours and lead time and improving energy efficiency of their equipment.
The framework used in this study, which combines deep reinforcement learning and Bayesian optimization, can be applied to problems other than conveyor line problems, and could offer an optimal control logic especially for problems that cannot be handled with classical control theories. We will aim to implement the successful results obtained in this study into actual equipment as early as possible and expand the applications of deep reinforcement learning and Bayesian optimization, focusing on maximizing customers’ value.
— Acknowledgments —
We here would like to express our gratitude to Katsuhiro Nishinari, Professor of Research Center for Advanced Science and Technology, the University of Tokyo for his advice.
REFERENCES
- E. Nakai : Introduction to Reinforcement Learning Theory for IT Engineers, Gijutsu-Hyoron Co., Ltd., 2020
- V. Mnih, K. Kavukcuoglu, D. Silver, A. A. Rusu, J. Veness, M. G. Bellemare, A. Graves, M. Riedmiller, A. K. Fidjeland, G. Ostrovski, S. Petersen, C. Beattie, A. Sadik, I. Antonoglou, H. King, D. Kumaran, D. Wierstra, S. Legg and D. Hassabis : Human-level control through deep reinforcement learning, Nature, Vol. 518, Iss. 7 540, 2015, pp. 529-533
- J. Schulman, F. Wolski, P. Dhariwal, A. Radford and O. Klimov : Proximal Policy Optimization Algorithms, https://arxiv.org/abs/1707.06347, accessed 2021-8-23
- B. Shahriari, K. Swersky, Z. Wang, R. P. Adams and N. de Freitas : Taking the Human Out of the Loop: A Review of Bayesian Optimization, Proceedings of the IEEE, Vol. 104, Iss. 1, 2016, pp. 148-175
- K. Nishinari : Studies of Congestion, Shinchosha, 2006