Evaluation of Power Generation of Ocean Current Turbine System
FUJITA Yutaka, ICHIGUCHI Masahiro, OKA Ryotaro, KONISHI Nobukatsu, INAMURA Akinobu

FUJITA Yutaka : Manager, Mechatronics & System Engineering Group, Technology Platform Center, Technology & Intelligence Integration
ICHIGUCHI Masahiro : Industry System Department, Control System Division, IHI Inspection & Instrumentation Co., Ltd.
OKA Ryotaro : Engineering Department, Business Development Headquarters
KONISHI Nobukatsu : Advanced Control & Intelligent Sensing Group, Technology Platform Center, Technology & Intelligence Integration
INAMURA Akinobu : Manager, Engineering Department, Business Development Headquarters
We evaluated the power generation performance of the floating-type ocean current turbine system based on the results of the demonstration test in 2021. We confirmed that continuous and stable power generation operation is possible under various current velocity conditions, and we obtained power generation performance such as power curve and internal power consumption. We calculated the facility utilization ratio by combining the power generation performance with the measured annual Kuroshio Current velocity data. The results confirmed that this system is a promising renewable energy generation method in the future.
1. Introduction
Demonstration tests of the floating-type ocean current turbine system, which is under development in IHI, were conducted in the area of real ocean in 2017 and during the period from 2019 to 2022(1). Few power generation tests had been conducted generating electric power by harnessing ocean current energy in the actual Kuroshio Current. Through the demonstration tests, we acquired knowledge of the characteristics of the ocean currents and obtained valuable data that verify the feasibility of this system. This paper describes the power generation performance and capacity factor that were evaluated and studied based on the results of the demonstration tests in 2021. In addition, this paper also describes a study on utilizing the generated power as a power source for a remote island based on the annual Kuroshio Current velocities and the capacity factor. We recommend that readers also refer to reference (1), which provides an outline of these ocean current power generation demonstration tests.
2. Demonstration tests
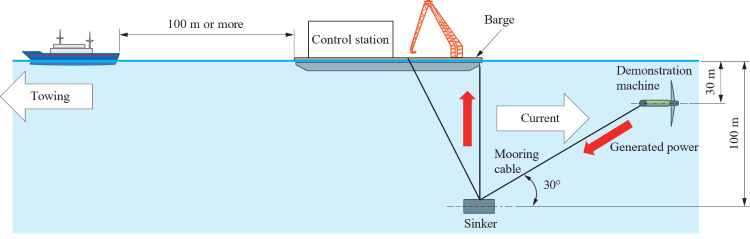
Two types of demonstration tests were conducted in 2021: one is a “power generation stability test” in which a tugboat tows a demonstration machine to generate power, and the other is a “Kuroshio Current hovering test” in which the demonstration machine is stationed at a fixed point in a Kuroshio Current area to generate power using the ocean current. The demonstration machine was controlled from a control station set up on a barge, and the generated power was transmitted through a dynamic cable along a mooring cable to the barge and consumed by a resistant load device on it. As shown in the test configuration diagram in Fig. 1, the tugboat in front controlled the position and speed of the barge, and in the Kuroshio Current hovering test, the barge was tracked by GPS to keep the barge at a fixed point in the ocean current. We focused on the following four items in conducting evaluation and verification in the tests.
2.1 Power fluctuation
In the preparation study stage, we thought likely that generator control was the cause of the generated power fluctuations(2) observed in the demonstration test in 2017. For this reason, we checked the relationship between the generator control gain and the generated power fluctuation, and then examined how much the power fluctuation can be reduced by adjusting the control gain.
2.2 Emergency stop/load shutdown
We confirmed that the power generation of the demonstration machine can be stopped without any problems via an emergency stop test and a load shutdown test. The emergency stop test was planned so that the demonstration machine rapidly rises to the sea surface when the emergency stop button is pressed during the operation of power generation. The load shutdown test was planned so that power transmission stops when the vacuum circuit breaker (VCB) of the primary power supply is opened while the demonstration machine is operating at its rated power generation rate.
2.3 Capacity factor
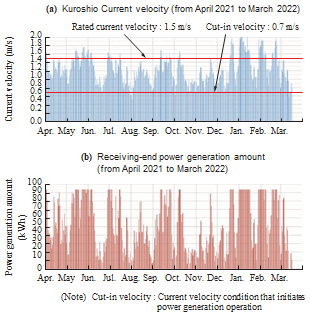
The capacity factor was estimated as an indicator of feasibility analysis. By measuring the current velocity and generated power, a power generation characteristic curve (power curve) versus the current velocity of the demonstration machine was created. This curve is multiplied by the current velocity at every moment in the area of the Kuroshio Current, and then integrated for a certain period to calculate the capacity factor. In addition, the internal power consumption of the demonstration machine is measured to provide data for calculating the capacity factor. A current meter was installed in the Kuroshio Current area near Kuchinoshima Island in Toshima Village, Kagoshima Prefecture, to measure current velocity from April 2021 to March 2022.
2.4 Power source for remote islands
Renewable energy such as ocean current power generation is a promising resource, particularly in remote island environments, which usually depend on diesel engines for power generation. A study was conducted to identify the effects and issues associated with connecting an ocean current turbine system to the grid system of a remote island based on the previously mentioned capacity factor and annual Kuroshio Current velocities, as well as the power generation test results obtained by using the demonstration machine in the Kuroshio Current area.
3. Results
3.1 Power fluctuation
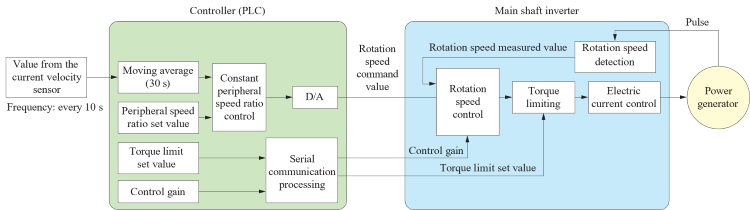
Figure 2 shows a power generator control block diagram. The inverter of the generator performs feedback control of the rotation speed. The rotation speed command value is calculated inside the controller so that the peripheral speed ratio (ratio of the turbine blade tip speed to the ocean current velocity) remains constant. This command value is sent as an analog signal to the inverter.
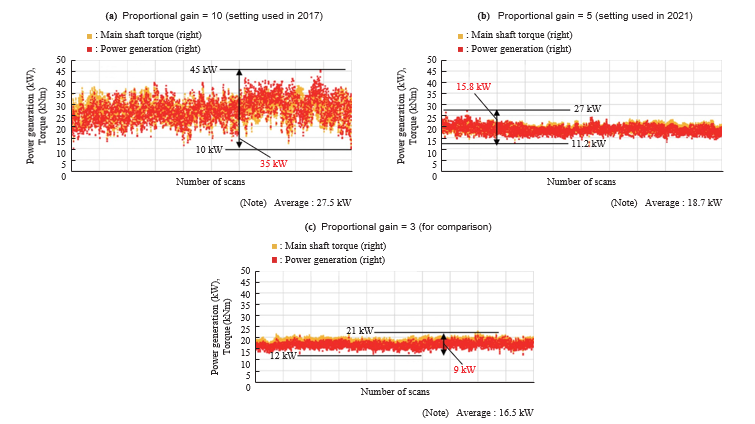
During the demonstration test in 2021, we first investigated the impact of the rotation speed control gain on power fluctuations. There are two types of control gain: proportional gain and integral gain. Figure 3 shows generated power time fluctuations with three different proportional gains. With a smaller proportional gain, the fluctuations in the power are smaller. This shows that during the 2017 power generation test a large proportional gain contributed to the overreaction of the generator to rotation speed command values, which is one of the causes of the large electric power fluctuations. The 2021 test results show that by adjusting only the proportional gain we can significantly reduce power fluctuations (with a proportional gain of 3, power fluctuations were reduced by 57%). However, because excessively small proportional gains destabilize turbine blade rotation speed control, in this test we used a gain value that minimized power fluctuations and stayed within the range where control is stable (a proportional gain of 5 was used, and the power fluctuation reduction rate was 34%).
3.2 Emergency stop/load shutdown
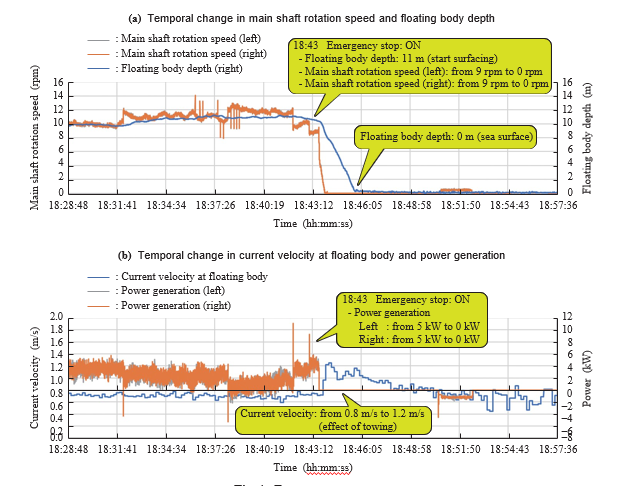
The demonstration machine has a function, responding to an emergency stop operation to stop the turbine blades and go up to the sea surface when an unexpected incident occurs while in operation. Figure 4 shows the emergency stop test. When an emergency stop operation was executed, the turbine blade (main shaft) rotation speed was reduced to zero and the floating body depth changed to zero meters as can be seen in their changes over time shown in Fig. 4-(a), which indicates that this function is working normally.
Next, system behavior in the event of a load shutdown was checked. When a ground fault or short-circuit occurs during the operation of power generation, the vacuum circuit breaker is opened to cut off the load so that power generated by the demonstration machine is not sent out. At this time, the output of the power generator of the demonstration machine is disconnected from the inverter and connected to the load resistor in the demonstration machine body, and at the same time, the turbine blades are put in a feathering state (making the turbine blade pitch angle parallel to the ocean current) to prevent the force of the ocean current from driving the power generator.
When load shutdown was carried out while running under the rated load, the system behaved as shown in the load shutdown test in Fig. 5. Because the turbine blades are put in a free-run state (no torque to control the rotation speed of the generator) immediately after load shutdown, the turbine blade rotation speed may have exceeded the allowable speed (25 rpm). However, in the demonstration test, it was confirmed that the maximum rotation speed did not exceed 20 rpm. When the turbine blades were feathered, the rotation stopped. After that, the buoyancy of the demonstration machine gradually ascended towards the sea surface, and it completely surfaced from a depth of 10 m in approximately four minutes.
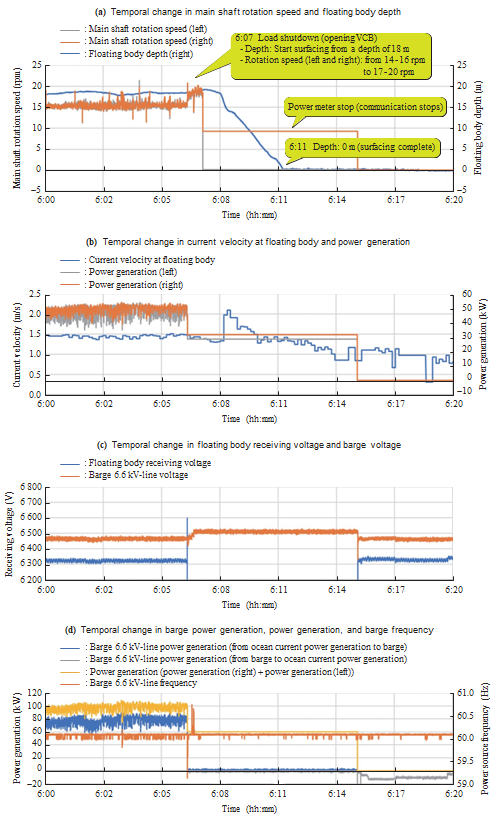
The difference between emergency stop and load shutdown is that in emergency stop, the turbine blades stop parallel to the sea surface, while in load shutdown, they stop at an arbitrary angle. This is because load shutdown cuts off the main power, leaving the turbine blade rotation speed uncontrollable. The test results indicated that it is feasible to stop turbine blades in a horizontal position by controlling the blade pitch angle and the timing of generator braking. Because practical machines will have larger-diameter turbine blades than the demonstration machine, the capability to stop turbine blades in a horizontal position will be highly desirable. The design of practical machines, therefore, will incorporate the knowledge acquired through these tests.
3.3 Estimation of capacity factor
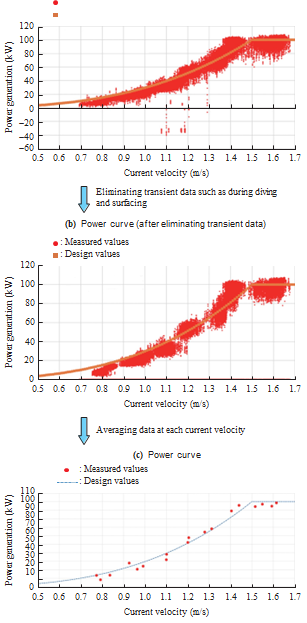
In order to obtain the power curve to be used to calculate the capacity factor, power generation was measured for different current velocities. The selected current velocities were between 0.7 and 1.7 m/s. When the generated power increased in the high flow velocity, the turbine blade pitch angle was controlled so as to limit the generated power to within 100 kW. Figure 6 shows the power curve. The horizontal axis represents current velocity and the vertical axis represents power generation. As the raw measurements varied considerably, data at transient states such as staying on the sea surface or diving underwater were eliminated, and the remaining data were averaged at each current velocity to obtain the power curve. The power curve thus obtained shows good agreement with the designed power curve, indicating that the turbine design for this demonstration machine was appropriate.
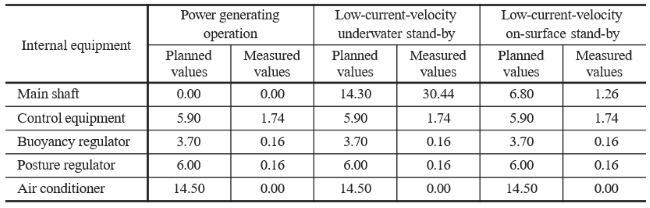
Next, the internal power consumption was examined. In this test, in addition to improving energy efficiency by modifying buoyancy and attitude control methods, the internal power consumption was minimized by improving the cooling system for removing the heat generated during power generation. This improved system was used to estimate the internal power consumption by conducting a fixed point operation test in the Kuroshio Current area and the Kuroshio Current hovering test. The results are shown in Table 1, internal power consumption. As shown, the internal power consumption during normal power-generating operation is very small. In contrast, the internal power consumption is maximized when the power generator works as a motor to keep the ocean current turbine system underwater in a stand-by state. This is because the turbine system stays underwater when the ocean current velocity is low as shown in the “Low-current-velocity underwater stand-by” columns. Internal power consumption, therefore, can be minimized by avoiding such operation. As an example of energy-efficient operation, in this test, power consumption was also measured in the case where the ocean current turbine system stands by on the water surface as shown in the “Low-current-velocity on-surface stand-by” columns. The results show that such operation can reduce power consumption.
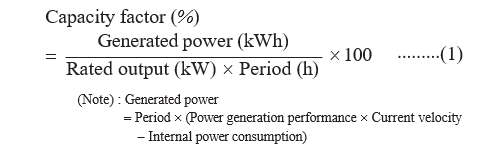
The power curve and the internal power consumption shown above were used to calculate the capacity factor. Equation (1) shows the definition of the capacity factor. The capacity factor is estimated by substituting the experimentally obtained measurements in this equation.
First, the capacity factor in the demonstration test area is calculated. The power generation performance refers to the power curve (dimension: power/velocity), which is multiplied by the hourly averaged Kuroshio Current velocity measured. The internal power consumption corresponding to each current velocity is subtracted from this result, and then 24 results corresponding to each hour of a day are summed up to give the amount of power generated per day so that an annual power generation graph is obtained. This process provides a prediction of fluctuations in power generation that reflect fluctuations in the Kuroshio Current velocity. Figure 7 shows the estimates of annual current velocity and annual power generation in the demonstration test area. The capacity factor is obtained by dividing the annual total of generated power by the product of the rated output and period. Assuming operating the demonstration machine used in this test for one year, the capacity factor is estimated to be 22.2%. Because of restraints associated with the installation work, the demonstration test had to be conducted in an area with a water depth of 100 m or less, and because sufficiently fast ocean currents were not available, the capacity factor tended to be somewhat lower than expected. Nevertheless, this capacity factor is comparable with those achievable with solar power and wind power generation systems(3).
3.4 Study on connecting to a power grid in a remote island environment
Because the power generated by the ocean current fluctuates depending on the current velocity, the power generation system cannot be directly connected to the power grid of a small remote island such as Kuchinoshima. Assuming connection to the power grid of Kuchinoshima, a power leveling system with a battery for storing the generated power was designed. Figure 8 shows the configuration of the system designed as an example of an ocean current power generation system for a remote island (a small-scale power grid). Assuming this system configuration, power fluctuation on the transmission end (indicated by a red arrow in the figure) was simulated. Fluctuations in power must be made as small as possible before it is connected to a power grid. For this reason, it was assumed that an emergency diesel power generator is installed as part of onshore equipment to prepare for a possible failure of the ocean current turbine system, and the use of a power leveling system capable of storing surplus power was also assumed.
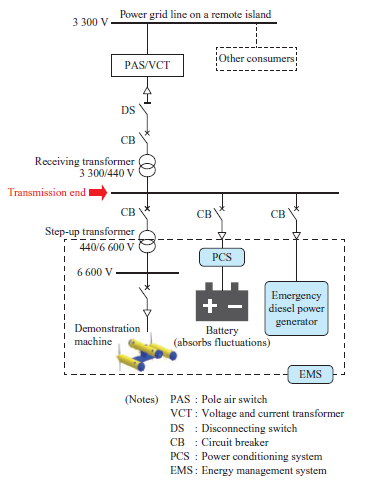
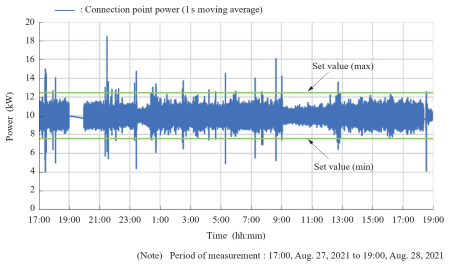
Figure 9 shows the simulation results of power fluctuations at the transmission end. In this simulation, power generation data obtained by the actual Kuroshio Current hovering test was used as input and the supply power to the grid was assumed to be 10 kW. We aimed to keep the per-second power fluctuations within ±4.9 kW (a temporary target value set by consulting with the power company based on the power source capacity of the remote island; the range between the two horizontal lines in Fig. 9). However, the simulation results show some points outside of this range. A closer analysis revealed that the deviations occurred when actuators were quickly driven to the maximum output in the demonstration machine or when the machine rapidly rose to the sea surface. It is believed, therefore, that by improving the control and operation methods and using a battery with a capacity appropriate for the power fluctuations, these fluctuations can be kept to within the target range in the commercial version of the machine. These study results show that the ocean current turbine system, if equipped with appropriate power transmission facilities, can be connected to a small-scale power grid on a remote island.
4. Discussion
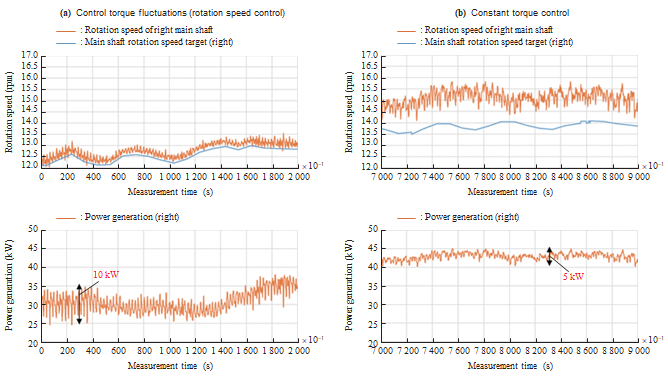
The test results show that the main shaft proportional gain affects power fluctuations. Because the proportional gain affects the torque of the power generator, we examined focusing on the generator torque. Consequently, we found that the behavior of the generator torque fluctuations coincided with that of the power fluctuations. In other words, constant-torque control is the most appropriate control method for suppressing power fluctuations. Figure 10 shows power generation fluctuations during operations with two control methods: rotation speed control and constant torque control (in Fig. 2, the rotation speed control in the inverter was switched to constant torque control). A comparison of these two different control methods shows that constant torque control is better for reducing power fluctuations.
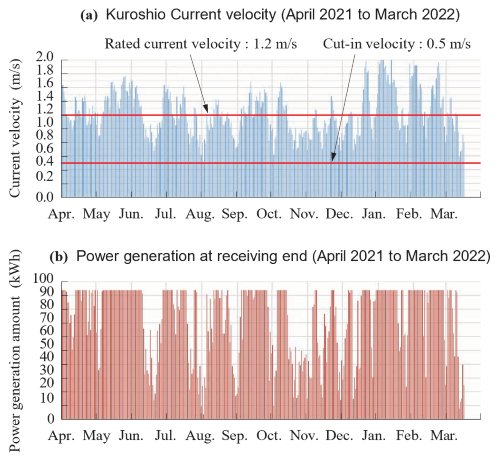
Because the ocean current velocity was smaller than expected in the demonstration test area, the capacity factor was comparable to those of other renewable energy facilities (simulation of one-year operation gave 22.2%). However, as shown in the annual power generation data of Fig. 11, where the design of rated current velocity was changed to 1.2 m/s, it will be possible to increase the capacity factor up to 38.4% by setting the rated current velocity to 1.2 m/s and the cut-in velocity (current velocity condition that initiates power generation operation) to 0.5 m/s. In addition, our calculation shows that a capacity factor of 65 to 77% can be achieved with a practical machine for an output of 2 MW, which indicates that this power generation system can be operated at a high capacity factor.
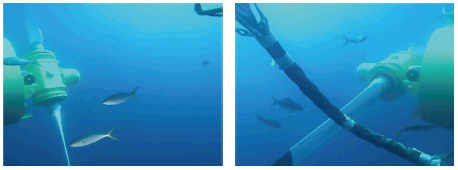
Ocean current power generation is also environmentally friendly. Figure 12 shows images captured with an underwater camera of a turbine blade and its vicinity during power generation operation. Fish swimming near the rotating turbine blades indicates that ocean current power generation harmonizes with nature.
5. Conclusion
Based on the demonstration test results of ocean current power generation, capacity factors were estimated and evaluated. The results indicated that generating the target amount of power using ocean current energy (100 kW at a current velocity of 1.5 m/s) is feasible for the ocean current turbine system. By evaluating capacity factors and power fluctuations assuming connection to the power grid of a remote island, we obtained practical design expertise associated with parameters such as rated current velocity, cut-in velocity, and turbine blade diameter appropriate for the current velocities in the sea areas where an ocean current turbine system is to be installed. We will continue to study the feasibility of ocean current power generation based on the knowledge obtained and issues identified through the demonstration test.
- — Acknowledgments —
- The demonstration test was conducted as part of a project subsidized by the New Energy and Industrial Technology Development Organization (NEDO). The authors would like to express their appreciation for NEDO’s generous cooperation in connection with the test. The authors are particularly grateful to Dr. Kyoji Kamemoto, Professor Emeritus of Yokohama National University and the chair of the research evaluation committee, for his generous guidance.
We deeply thank the late Mr. Masayuki Shimizu who greatly contributed to the development of the control system used in the ocean current power generation demonstration machine.
REFERENCES
- Y. Dodo and F. Ochi : Demonstration Test of Ocean Current Turbine System for Reliability and Economic Performance Evaluation, IHI Engineering Review, Vol. 56, No. 2, 2023
- M. Shimizu, S. Nagaya, T. Ueno, H. Saito, S. Murata and A. Ito:Development and Demonstration test for Floating Type Ocean Current Turbine System conducted in KUROSHIO CURRENT,Grand Renewable Energy 2018 Japan council for Renewable Energy, (2018), p. 239
- Agency for Natural Resources and Energy, Ministry of Economy, Trade and Industry : Renewable Energy in 2030, July 2021, https://www.meti.go.jp/shingikai/enecho/denryoku_gas/saisei_kano/pdf/034_01_00.pdf, accessed 2022-4-29 (in Japanese)