Analytical Evaluation of Structural Performance for Reinforced Concrete Road Bridge Decks Considering Cracks in Concrete
YOSHIDA Yuki, TAKESHIMA Natsumi, NIE Jing, KISAKU Tomoaki, OKADA Seiji
YOSHIDA Yuki : Materials & Structural Engineering Group, Technology Platform Center, Technology & Intelligence Integration
TAKESHIMA Natsumi: Research and Development Department, LCB·DX Division, IHI Infrastructure Systems Co., Ltd.
NIE Jing : Materials & Structural Engineering Group, Technology Platform Center, Technology & Intelligence Integration
KISAKU Tomoaki : Doctor of Engineering, P.E.Jp (Civil Engineering), Manager, Materials & Structural Engineering Group, Technology Platform Center, Technology & Intelligence Integration
OKADA Seiji : Doctor of Engineering, General Manager, Research and Development Department, LCB·DX Division, IHI Infrastructure Systems Co., Ltd.
There are many deteriorated reinforced concrete road bridge decks (RC slabs) in Japan. Limited maintenance and renewal budgets create a need for the technologies to prioritize repair and replacement of in-service RC slabs. Techniques to evaluate the structural performance of in-service RC slabs, such as load carrying capacity and failure process, are potential prioritization criteria. Nonlinear analysis is used in evaluating the structural performance of RC slabs because of its capability for appropriately considering the influence of cracks existing in concrete. Therefore, the accuracy of nonlinear analysis was verified by reproducing various loading tests of the RC slab specimen. The results indicate that nonlinear analysis is effective as a criterion technique for determining repair and replacement priorities.
1. Introduction
The deck of a road bridge is a floor slab that transfers the loads from pedestrians and vehicles passing on the road bridge to girders and other bridge members. Among various types of road bridge decks, reinforced concrete slabs (hereinafter referred to as “RC slabs”) are one of the most common types of decks that have been in use over many years. RC is an abbreviation for “Reinforced Concrete,” concrete reinforced with reinforcing bars, and a structure in which reinforcing bars are placed inside concrete is called an RC structure. RC slabs are widely used because they are easy to construct and economical.
In Japan, construction demand increased explosively during the period of rapid economic growth (1955–1973). The number of 50-year or older road bridges is expected to reach about 40% of all road bridges in Japan by 2023 and over 60% by 2033(1), (2). Such deterioration of existing bridges is not simply determined by their ages, but the degree of deterioration varies depending on the environmental conditions of each bridge site and the maintenance situation. It is therefore necessary to carry out repairs and replacement efficiently within a limited budget. This is why there is a need for technologies to accurately evaluate the structural performance of in-service RC slabs and prioritize repair and replacement needs. Accurate evaluation, however, is difficult because the failure behavior of RC structures is complex.
Furthermore, since the theoretical formulas commonly used for design calculation are intended for application to structurally sound slabs, it is difficult to allow for the effects of existing cracks and ongoing material deterioration. Nonlinear analysis, which has come into widespread use in recent years, however, makes it possible to allow for the effects of cracking and material deterioration of concrete. In this study, in order to contribute to the maintenance of existing structures, the results of a number of loading tests conducted in the past are reproduced by nonlinear analysis to show that the structural performance of in-service RC slabs can be evaluated.
Compared with linear analysis, nonlinear analysis yields varied results under the influence of details such as the material models, modeling methods, load increments, and solution methods. The first step, therefore, is to focus on basic failure modes of RC slabs, namely, flexural tension failure, diagonal tension failure, and punching shear failure, and verify the validity and analytical accuracy of the nonlinear analysis approach by reproducing the results of static loading tests on RC beams. This is followed by analytical reproduction of the results of a four-point bending test conducted on a beam specimen by using a 90-year-old RC slab with a special structure. The purpose of this is to determine whether it is possible to evaluate the load-carrying capacity and failure process of an RC slab even if it has a special structure.
2. Nonlinear analysis of RC structures
2.1 Overview
Concrete has a number of advantages: it has high compressive strength, is easier to shape freely than steel, and is relatively inexpensive. A drawback, on the other hand, is low tensile strength. Therefore, steel reinforcing bars are used to resist tensile force in order to compensate for the weakness of concrete and increase the load-carrying capacity of concrete structures.
Concrete is prone to cracking due to external forces and changes in temperature and humidity. Reinforcing bars in RC structures are also prone to corrosion caused by the intrusion of deterioration-causing factors. Cracking of concrete due to corrosion-induced expansion of reinforcing bars further accelerates the deterioration of RC structures. Material deterioration of in-service RC structures such as cracking affects the failure behavior of the structures. In order to evaluate the failure behavior of RC structures that have undergone such cracking and material deterioration, it is desirable that nonlinear analysis be used. Nonlinearities that should be considered include material nonlinearity to allow for the nonlinearity of material response, geometrical nonlinearity to allow for the effect of large deformation of structures, and boundary nonlinearity to allow for the contact, slip, friction and the like between bodies. Furthermore, nonlinearity analysis of reinforced concrete structures is characterized by the consideration of significant nonlinearity due to cracking of concrete.
2.2 Constitutive laws for nonlinear analysis
This section introduces the relational expression (constitutive laws) used in this study to express material nonlinearity. For the modeling of RC structures, the constitutive laws(3), (4) to allow for multi-axis stress proposed by Maekawa et al. are used.
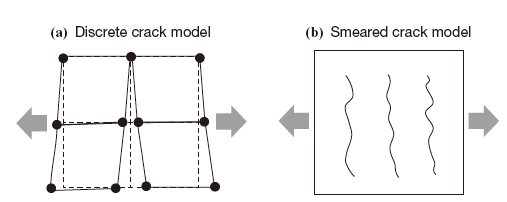
Figure 1 shows examples of concrete crack models. There are two widely used concrete crack models: the discrete crack model and the smeared crack model. In a discrete crack model, nodes between elements are disconnected, and crack opening displacement is regarded as relative displacement between elements. In a smeared crack model, crack opening displacement is treated as element-average strain on the assumption that cracks are smeared in elements. In this study, a smeared crack model suitable for use in cases where cracks occur uniformly in a member is used. Since a region that includes cracks can be treated as an element in a smeared crack model, there is no need to define crack locations in advance and the smeared crack model facilitates modeling.
There are two types of element crack models: the rotating crack model, in which the crack plane is rotated according to the principal stress, and the fixed crack model, in which geometrical information on cracks that have occurred are stored, and analysis is conducted by fixing the direction of cracking. Although a fixed crack model is used in this study, the axes of stress and strain gradually begin to deviate from each other as the deformation of the RC structure increases. In order to evaluate this accurately, in an analysis using a fixed crack model, it is necessary to model shear transfer across a crack plane separately.
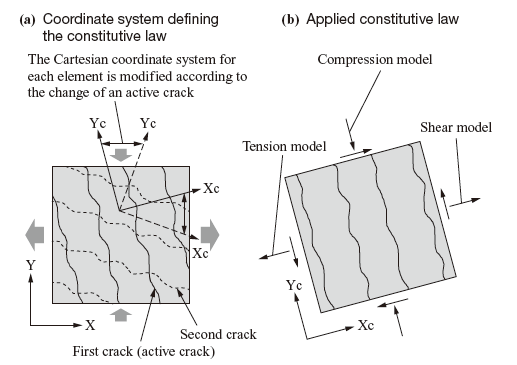
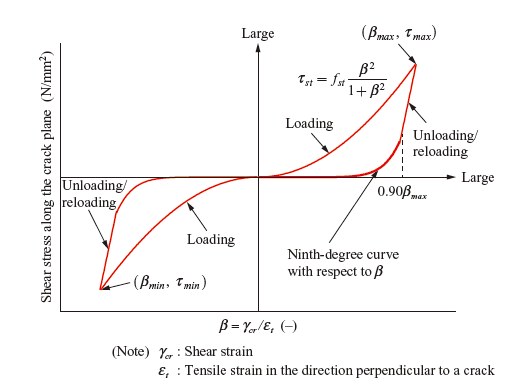
The shear transfer model for one-directional crack used in this study can allow for decreases in stiffness due to increases in crack width by parameterizing the ratio between shear strain along the crack plane and crack opening strain. Although multi-directional cracking is taken into account for each element, in most cases the principal nonlinearity is governed by unidirectional cracking. For this reason, we use the active crack model, in which dominant cracks are focused on, the local coordinate systems for their elements are rotated respectively, and then compressive, tensile and shear models are applied in each direction. In the case of two more or less orthogonal cracks, the intersecting angle range is limited to π/2 ± π/8 (these cracks are called “non-orthogonal cracks”). A model developed so that the directions of these non-orthogonal crackings to be considered are increased to four (two coordinate systems) is called the non-orthogonal multi-directional crack model, which is used in this study. The active crack method and the non-orthogonal cracking model are illustrated in Fig. 2.
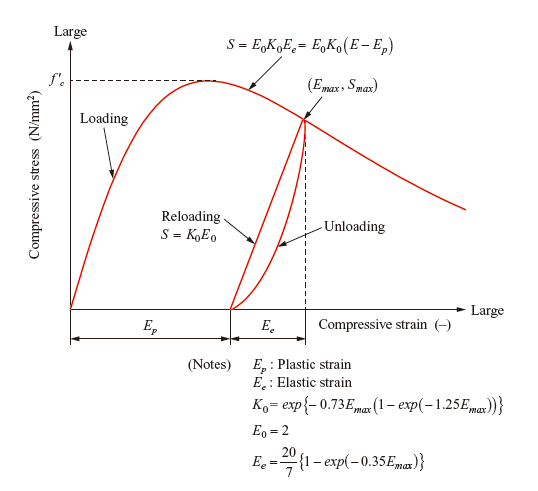
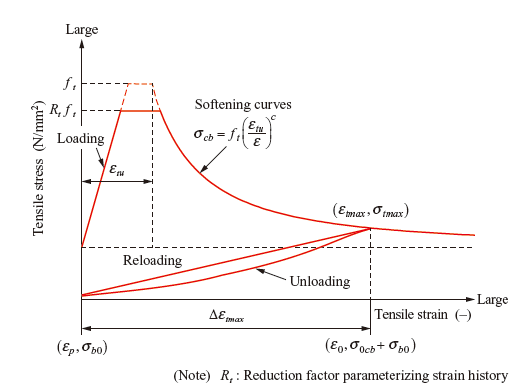
Figures 3 to 5 show the basic constitutive laws (the compression model, the tension model, and the shear transfer model for one-directional crack) for RC applied in this model. concept common to all of these constitutive laws is to consider average strains by averaging, in a certain range, the discontinuities of crack-induced displacement. It is to be noted here that when considering monotonic incremental loading, appropriate solutions cannot be obtained unless unloading paths are defined. This is because strain relaxation occurs in elements around cracks even under loaded conditions. For each of the constitutive laws, therefore, unloading and reloading paths are also defined.
For the modeling of reinforcement, a smeared reinforcement model that incorporates the effect of reinforcement in addition to concrete elements is used on the assumption that reinforcement is uniformly distributed in the concrete elements. The elements to which this smeared reinforcement model is applied are referred to as “RC elements.” In the tension range of RC elements, the average stress-average strain relation taking tension stiffening into account is used. Tension stiffening refers to the effect of reinforced concrete of increasing the stiffness in the stress-strain relationship in comparison with reinforcing steel alone. At a crack plane, concrete is not capable of resisting tensile stress. The bonding between reinforcement and concrete has the effect of transferring tensile stress by bypassing the crack locations so that concrete, too, can help resist tensile stress. In regions unaffected by such tension stiffening, reinforced concrete is modeled by use of plain concrete elements. Fracture mechanics theory is applied to plain concrete elements, and post-cracking softening curves are defined so that the amount of energy consumed in the elements is comparable to that of fracture energy (Fig. 4). The coefficient associated with softening is set according to element dimensions.
It has been pointed out that RC slabs of road bridges are prone to fatigue damage due to repeated moving loads such as vehicular loads, and studies are being conducted including service life estimation method(5), (6). The constitutive laws applied to the nonlinear analysis also take into consideration decreases in compression stiffness, tension stiffness and shear transfer capacity(5), (6).
3. Verifying the accuracy of analysis of basic failure behaviors
3.1 Overview
Standard Specifications for Concrete Structures (JSCE) introduce examples of analyses that are deemed to be highly reliable(7). With reference to those examples, a number of nonlinear analyses were conducted to reproduce the results of loading tests conducted on RC test specimens with the aim of verifying the validity and accuracy of nonlinear analysis in evaluating basic failure behaviors. In all analyses, solid elements were used for the modeling of concrete and steel.
3.2 Static four-point bending test on RC beam specimens
3.2.1 Analysis conditions
For the verification associated with flexural tension failure, the static four-point bending test(8) on RC beam specimens conducted by Okada et al. was analyzed. Okada et al. prepared their specimens by parameterizing the diameter of main reinforcement. In this study, SD345 steel deformed reinforcing bars 16 mm in diameter were used. Figure 6 shows the three specimens used (B16-2A, B16-2B and B16-2C). The three types of specimens have slightly different compressive strengths (34.7~36.2 N/mm2) of concrete. The specimens have a shear span, a , of 850 mm, a shear span ratio, a/d , of 5.667 ( d : effective height from the top of the specimen to the center of the reinforcement in the lower part of the specimen), a depth of 150 mm and a 500-millimeter-long uniform bending section. The failure mode of the specimens is flexural tension failure, where the concrete fails in compression after the yielding of the reinforcement.
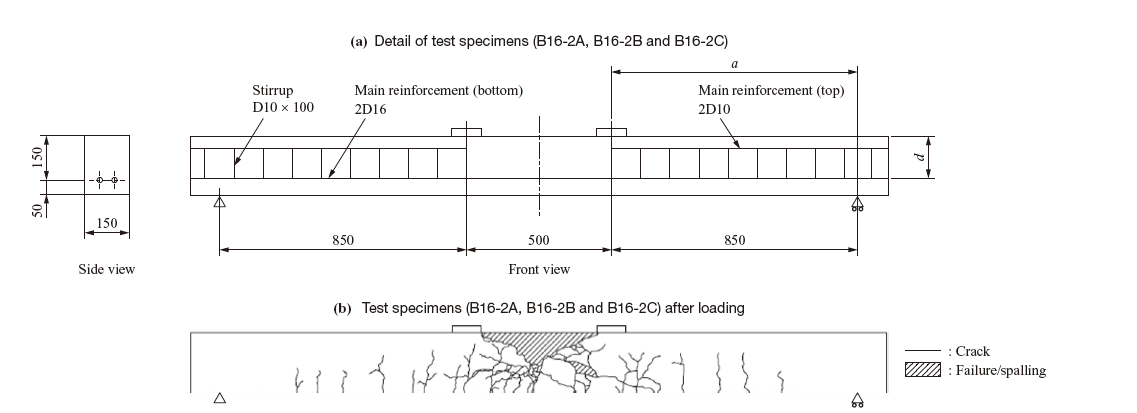
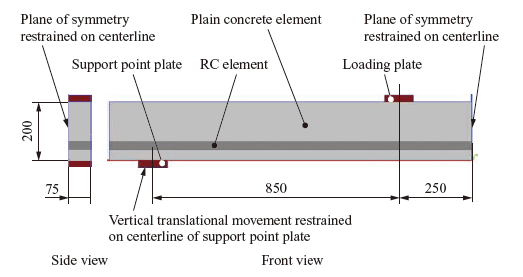
Figure 7 provided in the vertical translational movement direction along the centerlines of the steel plates placed at the loading point and the support point (hereinafter referred to as the “loading plate” and the “support point plate,” respectively). The Poisson’s ratio of concrete is assumed to be 0.20, and compressive strength is assumed to be 35.4 N/mm2, which is the average of the measured values. The static modulus of elasticity and tensile strength of concrete were estimated from compressive strength by using the formulas given in the Standard Specifications for Concrete Structures(7). Main reinforcing bars are D16 bars for the bottom reinforcement, D16 bars for the top reinforcement, and D10 bars for the stirrups(8). Reinforcement was modeled as bilinear, and the yield point of reinforcement was assumed to be 362 N/mm2 as shown in the paper(8). Young’s moduli and Poisson’s ratios of steel members and reinforcing bars were assumed to be 2.06 × 10⁵ N/mm2 and 0.30, respectively. The loading plate and the support point plate were modeled with linear elasticity, and joint elements(9) were placed at the boundaries of the loading plate and the support point plate with the concrete to allow for the effects of contact and friction. The coefficient of contact friction was set at 0.5 in accordance with the Standard Specifications for Hybrid Structures(9). Loads were applied vertically downward under displacement control at a node on the centerline of the loading plate.
3.2.2 Analytical results
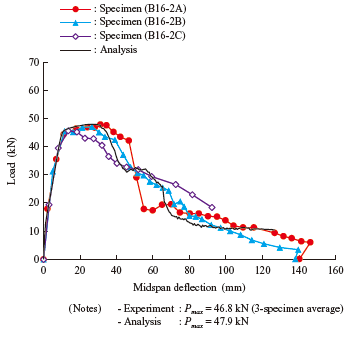
Figure 8 shows the load-midspan deflection relationships obtained from the experiment and the analysis. In the experiment, the three specimens showed agreement in terms of the load-midspan deflection relationship during the loading process until the reinforcement yielded at about 45 kN. The average value of the maximum loads of the three specimens in the experiment was 46.8 kN. The analytical results followed a path similar to the paths observed in the experiment until the yielding of the reinforcement, and thereafter, too, the analysis showed a behavior similar to the behavior observed in the experiment. The maximum load in the analysis was 47.9 kN, indicating an error from the measured value of 2.3%. In view of the fact that the failure mode indicated by the analysis is flexural tension failure as in the experiment, it can be concluded that the analysis is sufficiently accurate.
3.3 Static three-point bending test on RC beam specimens
3.3.1 Analysis conditions
The test to be analyzed is the static three-point bending test(10) conducted by Fukasawa et al. Figure 9 shows the test specimen (Y1). The specimen has a shear span, a , of 800 mm, a shear span ratio, a/d , of 5.0 and a depth of 200 mm. The failure mode of the specimen in the test was diagonal tension failure: multiple flexural cracks occurred in the midspan region so that stiffness decreased, and then shear force caused diagonal cracks so that a failure occurred.
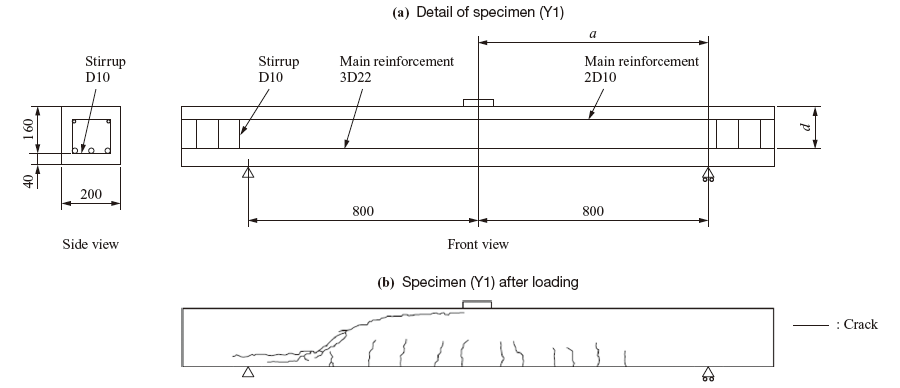
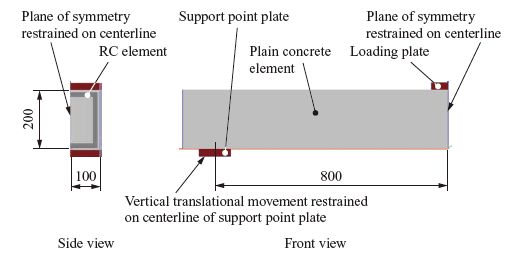
Figure 10 illustrates the analysis model. As for the analysis conducted to reproduce the flexural tension failure, a 1/4 model that takes symmetry into consideration was used, and the depth was set at 100 mm. Translational movement in the direction perpendicular to the plane of symmetry was restrained. The Poisson’s ratio of the concrete was set at 0.20, and a compressive strength of 37.5 N/mm2, which is the value given in the paper(10), was used. The static modulus of elasticity and tensile strength of concrete were determined with reference to the formulas given in the Standard Specifications for Concrete Structures(7). Main reinforcing bars are D22 bars for the bottom reinforcement, D10 bars for the top reinforcement, and D10 bars for the stirrups. The reinforcement was modeled as bilinear, and the yield point of the reinforcement was set at 362 N/mm2, which is the value shown in the paper(10). Young’s moduli and Poisson’s ratios of reinforcing bars and steel members are the same as the conditions shown in Subsection 3.2.1. The loading plate and the support point plate were modeled with linear elasticity, and the effects of contact and friction were taken into consideration. Loads were applied vertically downward under displacement control at a node on the centerline of the loading plate.
3.3.2 Analytical results
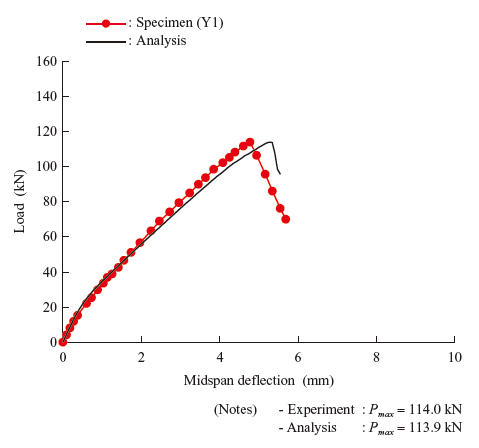
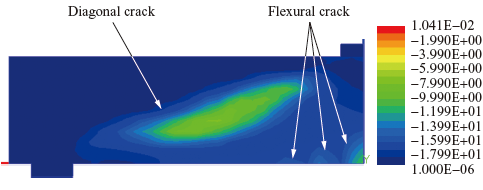
Figure 11 shows the load-midspan deflection relationships obtained from the experiment and the analysis. The measured maximum load and the maximum load obtained from the analysis conducted to reproduce the experiment result were 114.0 kN and 113.9 kN. Thus, the error from the experiment result was 0.1%. Figure 12 shows the contour of the first principal strain at the maximum load. These results confirm that the flexural cracks and diagonal cracks observed in the experiment also have been reproduced analytically.
3.4 Punching shear test on RC slab specimens
3.4.1 Analysis conditions
Punching shear capacity of RC slabs is important because it is used as an indicator for fatigue life evaluation. For the purpose of verification concerning the punching shear capacity of RC slabs, the punching shear test on RC slab specimens conducted by Tanaka et al.(11) was analyzed. Figure 13 shows the test specimen (0%). The specimen has a shear span, a , of 450 mm, a shear span ratio, a/d , of 3.75 and a depth of 900 mm. In the loading test, the compressive strength and static modulus of elasticity of concrete were 28.2 N/mm2 and 18.7 kN/mm2, respectively, and tensile strength was estimated from the equation given in the Standard Specifications for Concrete Structures(7). Main reinforcement, distribution reinforcement and stirrups are D16, D10 and D10 bars, respectively, and their yield strength is 382 N/mm2 and 391 N/mm2, respectively. Young’s moduli and Poisson’s ratios of reinforcing bars and steel members are the same as the conditions shown in Subsection 3.2.1.
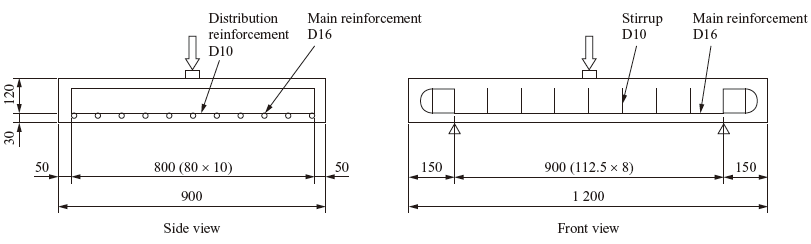
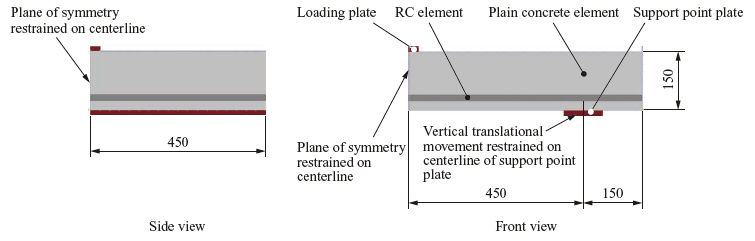
Figure 14 shows the analysis model. It is a 1/4 model that takes symmetry into consideration, and its depth is 450 mm. Translational movement in the direction perpendicular to the plane of symmetry is restrained. The loading plate and the support point plate are modeled with linear elasticity, and the effects of contact and friction are taken into account. Loads were applied vertically downward under displacement control at a node on the centerline of the loading plate.
3.4.2 Analytical results
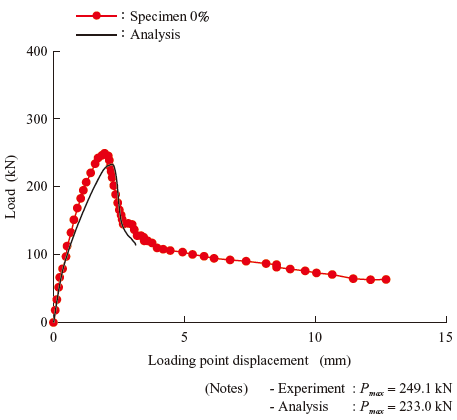
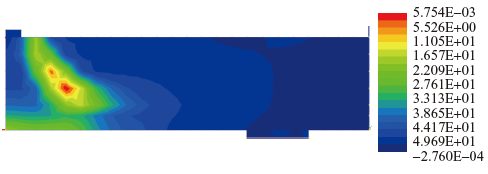
Figure 15 compares the load-midspan deflection relationships obtained from the experiment and the analysis. The maximum load is 249.1 kN in the experiment and 233.0 kN in the analysis. The error, therefore, is 6.5%. Figure 16 shows the contour of the first principal strain under the maximum load. In the punching shear test conducted as part of the reported study(11), the test specimen failed because of downward diagonal cracking that began from the loading point. It can be concluded, therefore, that the analysis reproduced the observed failure mode with good accuracy.
4. Static four-point bending test on complex-structured RC slab
4.1 Overview
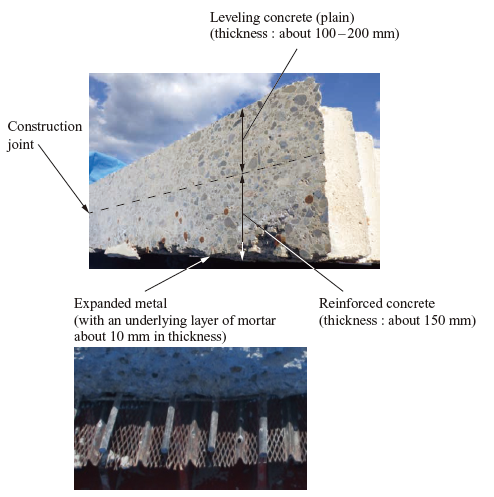
A static four-point bending test was conducted on a beam specimen taken from an RC slab that had been in service for more than 90 years(12). Figure 17 al structure of the real RC slab. Main reinforcement of the slab has been placed at the bottom, but there is no top reinforcement. The main reinforcement consists of straight and bent reinforcing bars placed alternately. Expanded metal is laid on the bottom surface of the slab. The slab is a two-layer structure consisting of the lower RC layer (hereinafter referred to as the “RC Section”) and the upper leveling-concrete (plain concrete) layer (“P-C Section”). This chapter verifies that the load-carrying capacity and failure process of a complex-structured RC slab like this can be reproduced through nonlinear analysis.
4.2 Test conditions
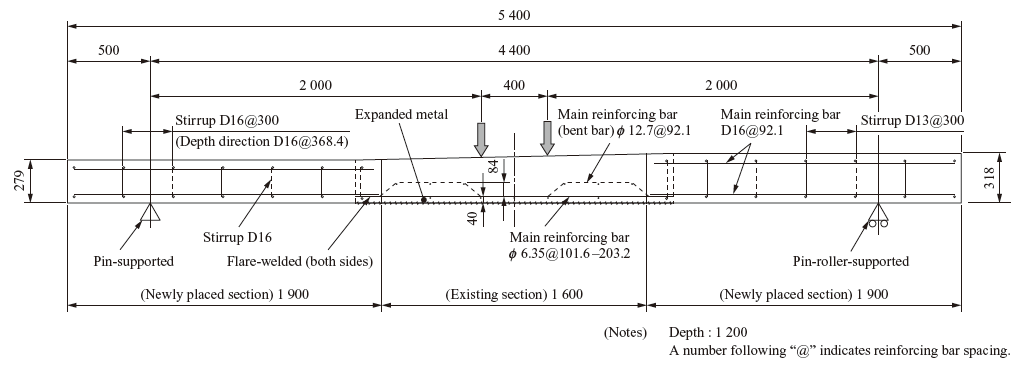
Figure 18 shows the RC beam specimen prepared by using the real RC slab. For the purpose of the test, a shear span ratio of 7.0 or more was retained so as to induce a flexural tension failure. In order to achieve the required length of the specimen, the specimen was extended by flare-welding additional reinforcing bars to the main reinforcing bars of the RC slab and placing new concrete at both ends. The test specimen thus prepared has a loading point span of 400 mm, a shear span of 2 000 mm and a support point span of 4 400 mm. The specimen is pin-supported at one end and pin-roller-supported at the other end, and loading is continued until midspan deflection reaches about 50 mm. The pin support condition means that rotation is allowed, and vertical and horizontal movement is restrained, and the pin-roller support condition means that movement in the longitudinal direction of the specimen is possible under the pin support condition. Further details of the test method and the analysis method described below has been reported in a previous paper(12).
4.3 Analysis conditions
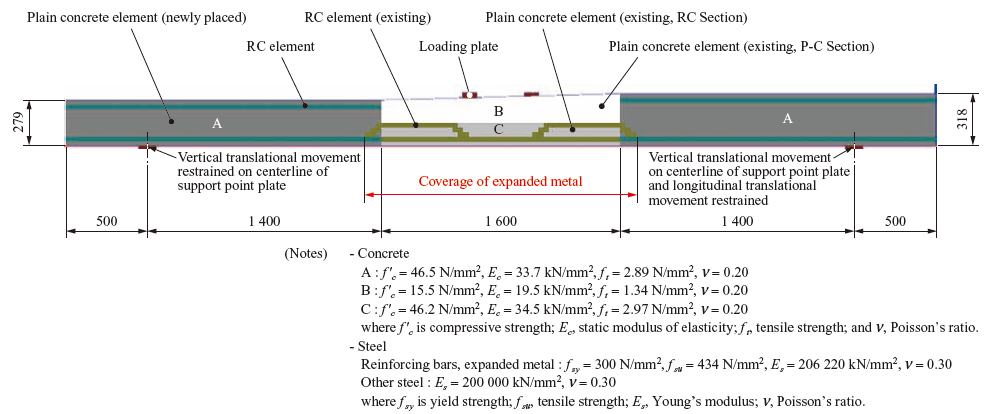
Figure 19 shows the analytical model used in this study. The concrete and steel members are modeled with solid elements. The analytical model is a 1/2 model that takes symmetry into consideration, and translational movement in the direction perpendicular to the plane of symmetry, vertical translational movement at the center of the span, and longitudinal translational movement at one support point are restrained. The characteristics of the slab, namely, the changes in slab thickness, the two-layer structure consisting of the RC Section and the P-C Section, and the bent reinforcing bars, are expressed, and loads are applied downward at the center of the two loading points. In order to take into consideration the delamination and relative displacement of the two concrete layers, nonlinear joint elements are provided between the RC Section and the P-C Section(13).
In the previous study (12) , two cases have been analyzed: Case 1, in which the expanded metal is modeled by placing lattice-shaped beam elements, and Case 2, in which the expanded metal is ignored. In the previous study, the yield strength of the expanded metal was assumed to be 235 N/mm2 according to the standard-specified value for SR235. For the purpose of this study, however, yield strength has been changed to 300 N/mm2, which is the measured strength of main reinforcing bars. In the previous study, the compressive strength of the P-C Section was assumed to be 15.5 N/mm2 (name of analysis case: Case 1-P15.5). In this study, the compressive strength of the P-C Section is varied as an analysis parameter in view of the following facts: visual observation of the P-C Section of the real RC slab revealed the existence of wood fragments embedded in the concrete; cracks that are thought to have occurred during asphalt cutting operations or during more than 90 years of service were found; and measured values of strength variemmd depending on locations in the material tests. In this study, two new cases, based on Case 1-P15.5, are considered: Case 1-P10, in which the compressive strength of the P-C Section is assumed to be 10 N/mm2, and Case 1-P5, in which it is assumed to be 5.0 N/mm2.
4.4 Analytical results
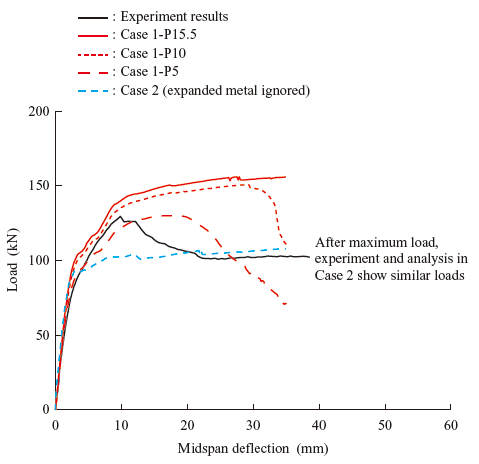
Figure 20 shows the load-midspan deflection relationships obtained from the experiment and the analysis. In Case 2, in which the expanded metal is ignored, the maximum load is smaller than the measured value by about 16.7%, while the loads after the maximum load are similar to the experimental results. In Case 1, in which the expanded metal is taken into consideration, the analytical results indicated behavior similar to the experiment results up to the maximum load, but the maximum load was larger than the experiment result by about 12%. The case that showed the closest agreement with the experiment results is Case 1-P5, in which the compressive strength of the P-C Section is assumed to be 5.0 N/mm2. These results indicate that the expanded metal on the underside of the slab, which greatly affects load-carrying capacity should be left in place, instead of being removed without any reason. The results also indicate that in order to estimate the load-carrying capacity of an existing structure with good accuracy, it is of utmost importance to correctly determine the condition of the structure
4.5 Evaluation of load-carrying capacity and failure modes
4.5.1 Loading test
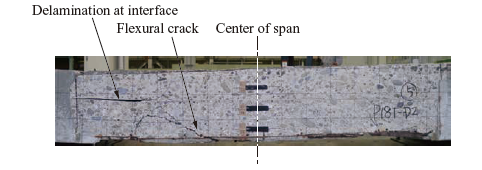
Figure 21 shows the appearance of the specimen after failure. In the experiment, when the load reached 115 kN, a flexural crack occurred not in the midspan region, but on the thin side of the slab, where the main reinforcing bars were bent up. After that, the reinforced concrete and the P-C Section became separated at the interface under the maximum load. Finally, the concrete on the compression side failed at the location where the flexural crack occurred. Strain gauge measurements indicated that the main reinforcement yielded before the compression failure occurred. It was concluded, therefore, that the failure mode of the specimen failed in flexural tension.
4.5.2 Reproduction analysis
Figure 22 shows the first principal strain contour at a midspan deflection of 3.0 mm in Case 1-P5, and Fig. 23 shows the vertical stress contour at a midspan deflection of 18.1 mm in the same case. As shown, the analytical results capture the crack location and the delamination of the RC Section and the P-C Section.

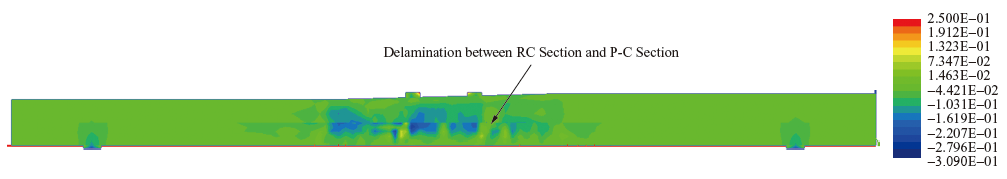
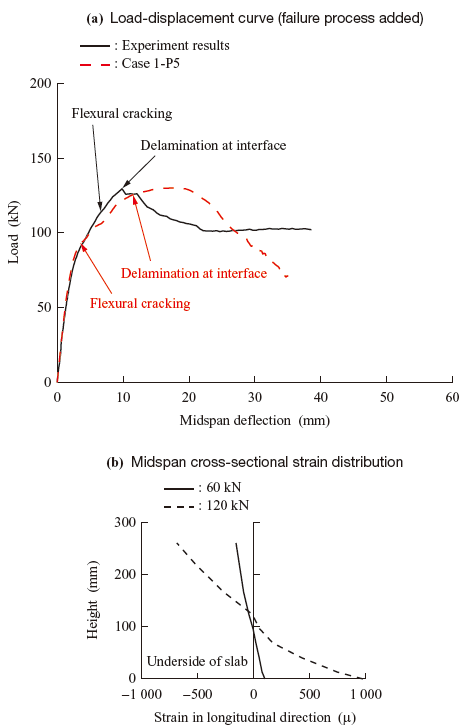
Figure 24 compares the failure processes indicated by the load-midspan deflection relationships obtained from the experiment and the analysis in Case 1-P5. The midspan deflections at which the flexural crack and the interface delamination occurred were estimated from the maximum principal strain and the cross-sectional distributions of longitudinal strain in the concrete. Comparison of Fig. 21 with Figs. 22 and 23 confirms that the locations of the flexural crack and the interface delamination show good agreement. In the analysis, the main reinforcement yielded prior to the occurrence of the compression failure, indicating that a flexural tension failure occurred as in the experiment.
5. Conclusion
The findings obtained from this study can be summarized as follows:
(1) It has been confirmed that basic modes of failure of a reinforced concrete (RC) beam, namely, flexural tension failure, diagonal tension failure and punching shear failure, can be reproduced analytically, and load-carrying capacity evaluated with good accuracy, by modeling a static loading test on an RC beam by use of nonlinear analysis.
(2) A nonlinear analysis conducted to reproduce a loading test on a specimen taken from an existing complex-structured RC slab showed that the material properties of an existing concrete structure affect not only the load-carrying capacity but also the post-peak behavior. It has also been confirmed that the actual failure process of a structure, even if complex in structure, can be reproduced analytically.
(3) In cases where an existing structure has steel members such as expanded metal, it is desirable that they be left in place in order to maintain the load-carrying capacity of the structure. It has also been confirmed that in order to evaluate the load-carrying capacity of an existing structure accurately, it is important to have a technology to correctly determine the condition of the structure.
Thus, main failure modes of an RC slab, namely, flexural tension failure, diagonal tension failure and punching shear failure, have been correctly evaluated through nonlinear analysis. It has also been shown that load-carrying capacity and failure processes are analytically reproducible even if the structure under consideration has complex structural features such as two-layer structure, expanded metal and bent reinforcing bars. Although it is not possible to measure the load-carrying capacity of the deck of an in-service road bridge by destructive testing, it is possible to theoretically evaluate the load-carrying capacity by making effective use of nonlinear analysis as in this study. Utilization of such nonlinear analysis technology makes it possible to evaluate structural performance of RC slabs from their specifications and deterioration conditions. By evaluating the results thus obtained together with actual traffic volume and traffic loads, future damage can be predicted so that the remaining useful life and repair and replacement priorities can be estimated. We believe that such evaluation technology will contribute to maintaining the soundness of social infrastructure and preventive maintenance.
- — Acknowledgments —
- We would like to express our deep appreciation to the staff of Osaka National Highway Office of the Kinki Regional Development Bureau, Ministry of Land, Infrastructure, Transport and Tourism, and the people involved in this study for the generous guidance and assistance provided in connection with this study.
REFERENCES
- Ministry of Land, Infrastructure, Transport and Tourism : WHITE PAPER ON LAND, INFRASTRUCTURE, TRANSPORT AND TOURISM IN JAPAN, 2019
- E. Fujiura, K. Katagiri, T. Wada, K. Aoki, M. Kubota, T. Obata and K. Hayakawa : A decision system of crack damage rank on infrastructures using Deep Learning, The 6th IIAE International Conference on Intelligent Systems and Image Processing 2018
- K. Maekawa, A. Pimanmas and H. Okamura : Non-Linear Mechanics of Reinforced Concrete, CRC Press, 2003, pp. 13-124
- K. Maekawa, N. Fukuura and X. An : 2D and 3D Multi-directional Cracked Concrete Model under Reversed Cyclic Stresses, MODELING OF INELASTIC BEHAVIOR OF RC STRUCTURES UNDER SEISMIC LOADS, 2001
- S. Matsui : Fatigue Strength of RC-Slabs of Highway Bridges by Wheel Running Machine and Influence of Water on Fatigue, Proceedings of the Japan Concrete Institute, Vol. 9, No. 2, 1987, pp. 627-632 (in Japanese)
- Comité Euro-International du Béton : Fatigue of Concrete Structures, No. 188, 1988
- Japan Society of Civil Engineers : STANDARD SPECIFICATIONS FOR CONCRETE STRUCTURES, 2017 “Design”, 2018 (in Japanese)
- T. Okada, S. Saito and T. Higai : Experimental Study on Deformation Behavior of RC Beams with Bending Failure, Proceedings of the Japan Concrete Institute, Vol. 25, No. 2, 2003, pp. 403-408 (in Japanese)
- JSCE Committee on Hybrid Structures : Standard Specifications for Hybrid Structures 2014, 2015 (in Japanese)
- Y. Fukazawa, S. Saito and R. Takahashi : A Study on the Repairing Effect of RC Beams with Diagonal Cracks, Proceedings of the Japan Concrete Institute, Vol. 35, No. 2, 2013, pp. 1 369-1 374 (in Japanese)
- Y. Tanaka and T. Sudoh : Punching shear mechanism of reinforced concrete slabs with corroded reinforcing bars, Journal of Structural Engineering, Vol. 59A, 2013, pp. 889-897 (in Japanese)
- Y. Yoshida, N. Takeshima, T. Kisaku and S. Okada : Deterioration property and structural performance of complex RC slab utilized for over 90 years, Journal of Structural Engineering, Vol. 67A, 2021, pp. 673-686 (in Japanese)
- B. Li and K. Maekawa : Stress Transfer Constitutive Equation for Cracked Plane of Concrete Based on the Contact Plane Density Function, Concrete Journal, Vol. 26, No. 1, 1988, pp. 123-137 (in Japanese)