
Development of Technologies for Aerodynamics, Aeromechanics and Noise of Low Pressure Ratio Fan
HAYASHI Ryosuke, TATEISHI Atsushi, KUSUDA Shinya
HAYASHI Ryosuke : Doctor of Engineering, Manager, Advanced Technology Department, Research & Engineering Division, Aero Engine, Space & Defense Business Area
TATEISHI Atsushi : Doctor of Engineering, Manager, Advanced Technology Department, Research & Engineering Division, Aero Engine, Space & Defense Business Area
KUSUDA Shinya : Doctor of Engineering, Manager, Advanced Technology Department, Research & Engineering Division, Aero Engine, Space & Defense Business Area
As the demand for reduction of specific fuel consumption (SFC) and noise in aircraft engines increases, addressing the design challenges of high bypass ratio and low pressure ratio civil aircraft engine fans requires the development of technologies for aerodynamics, aeromechanics and noise. This paper discusses the technological developments being undertaken at IHI to address these challenges. In aerodynamics, this paper introduces efforts to validate laminar flow areas on fan blade surfaces through test and to develop techniques for expanding the laminar flow area. In aeromechanics, flutter and non-synchronous vibration (NSV) are analyzed based on both test and computational fluid dynamics (CFD) results to explain the mechanisms of blade vibration. In terms of noise, the mechanism by which interference between fan blades and surrounding structures, such as the pylon, causes noise increase through distortion is clarified.
1. Introduction
Amid the recent global efforts to address climate change, reducing the environmental impact of aircraft engines has become an urgent priority. To tackle this challenge, engines must further reduce specific fuel consumption (SFC) and noise. Figure 1 illustrates the components of a civil aircraft engine (PW1100G-JM). To reduce SFC, the fan needs to draw in a larger volume of air, which increases the fan diameter. As the fan diameter increases, the fan rotates at a lower speed, resulting in a reduced fan pressure ratio. Thus, civil aircraft engine fans are increasingly characterized by high bypass ratios (where the amount of bypass airflow is significantly greater than the core airflow) and low pressure ratios.
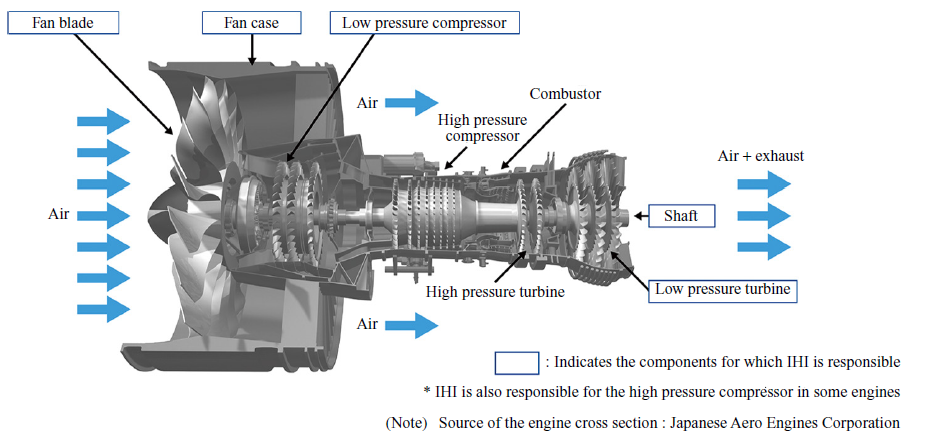
This paper introduces the key technologies in aerodynamics, aeromechanics (which integrates aerodynamics and structural mechanics, as well as fluid-related vibrations), and noise, all of which are crucial in the design of low pressure ratio fans.
2. Aerodynamics
2.1 Losses in low pressure ratio fans
The factors contributing to the losses in low pressure ratio fans include shock waves, blade tip leakage flows, blade surface friction, and secondary flows. Figure 2 shows the breakdown of losses in low pressure ratio fans. Since the loss caused by blade surface friction accounts for more than half of the total losses, this paper focuses on reducing this specific loss.
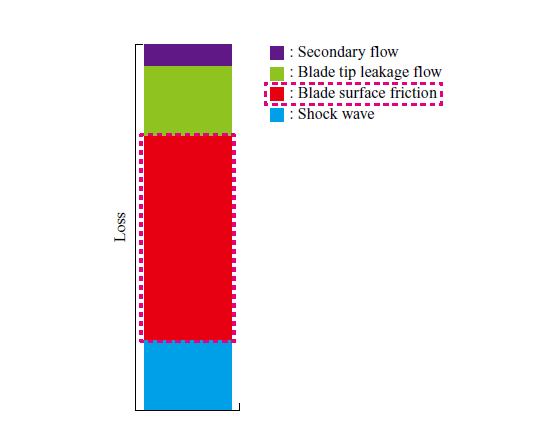
Detailed research on the blade surface friction losses in the blade surface boundary layer has been conducted through subsonic cascade tests. For example, research has been conducted on the impact of leading-edge blade surface roughness on the blade surface boundary layer transition and pressure loss caused by the blade surface boundary layer(2), as well as the impact of leading-edge shape on the blade surface boundary layer transition(3). On the other hand, research on the blade surface boundary layer for civil aircraft engine fans has not progressed sufficiently. This is because civil aircraft generally have long blade chords and high Reynolds numbers, meaning that laminar boundary layers are not typically assumed on the blade surfaces. Additionally, the relative inflow Mach number exceeds 1, making detailed measurements through cascade tests or other methods difficult.
2.2 Demonstration test of the laminar boundary layer in fans
This section introduces a rotary rig test(4) aimed at demonstrating the improvement in single-blade efficiency due to the laminar flow effect. Specifically, the laminar flow effect is defined as the difference in efficiency measured before and after installing a tripping device near the fan leading edge.
2.2.1 Aerodynamic design
Figure 3 shows the meridional view of the test rig designed in this research. The test rig simulates only the bypass section of a high bypass ratio fan and consists of 20 fan blades and 48 fan exit guide vanes (FEGVs).
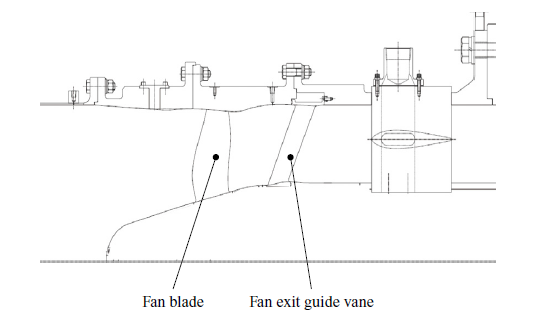
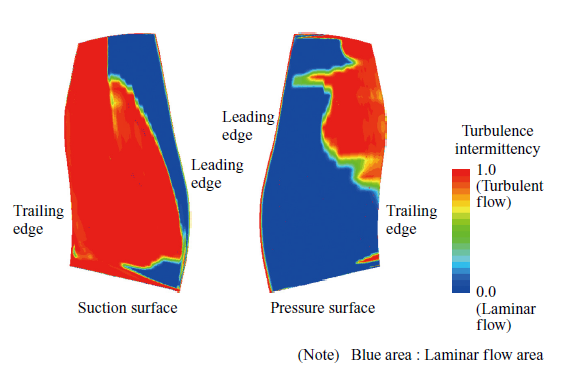
Previous research(4) investigated the impact of blade leading-edge shapes (circular arc and elliptical arc) on turbulent transition. Blades with a circular leading edge are likely to experience turbulent transition due to sudden flow acceleration and deceleration (spikes) when the inflow angle increases. On the other hand, blades with an elliptical leading edge are less likely to generate the spikes even when the inflow angle increases, making it easier for the boundary layer on the blade surface to remain laminar. Based on these findings, an elliptical shape was adopted for the leading edge of the fan designed in this research. Figure 4 shows the contours of turbulence intermittency (γ ) obtained from the analysis results of the γ-Reθ transition model(5) at the aerodynamic design point. In the figure, the blue area (γ = 0) represents laminar flow, and the red area (γ = 1) represents turbulent flow. Therefore, the results of the computational fluid dynamics (CFD) analysis confirmed that the fan designed in this research has a laminar flow area on the blade surface.
2.2.2 Demonstration test and results
The demonstration test was conducted using the 2.2 MW fan and compressor test facility in the Chofu Aerospace Center of the Japan Aerospace Exploration Agency (JAXA). Flow rate measurement was performed using an orifice flow meter installed on the exit duct. At the fan inlet, total pressure was measured using a total pressure gauge in the air storage chamber, and total temperature was measured with a resistance thermometer in the air storage chamber. At the fan exit, total pressure and total temperature were measured by total pressure probes and total temperature probes embedded in the FEGV leading edge.
In this test, to assess the laminar flow effect, performance was measured in two cases: one with a tripping device installed on the blade surface (turbulent flow) and one without it (laminar flow). Figure 5 shows the tripping device used in the test. The tripping device was installed at the 5% chord from the leading edge on both the pressure and suction surfaces of the blade (outlined by the dotted lines in the figure), and the tripping device was applied to all 20 blades. There was concern that installing the tripping device would cause pressure loss due to the step formed on the blade surface. However, it was confirmed that this pressure loss was small enough and negligible in measuring the performance difference between laminar and turbulent flows.
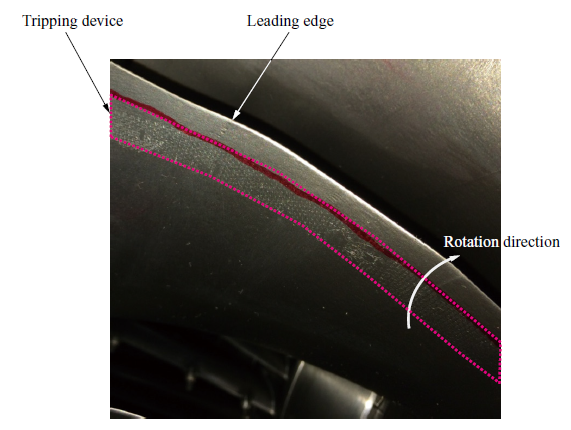
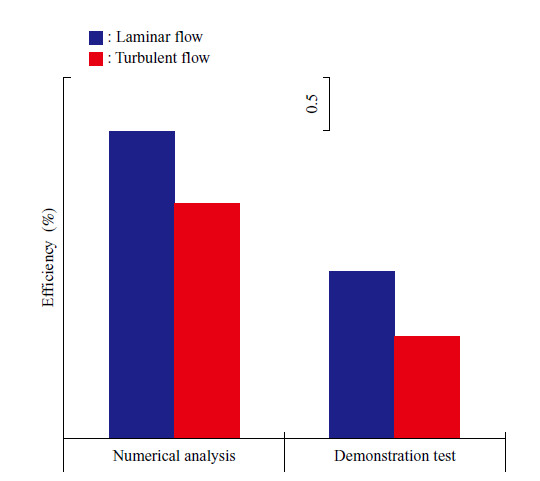
Figure 6 shows the differences in adiabatic efficiency due to the laminar flow effects near the design point. In the CFD analysis, the γ-Reθ transition model was used for laminar flow, and the shear stress transport (SST) model(6) was used for turbulent flow. Figure 6 indicates that there are efficiency differences in both the CFD analysis, due to the choice of turbulent flow models, and the demonstration test, due to the presence or absence of the tripping device. In other words, it is demonstrated that the fan designed in this research has a laminar flow area and that the adiabatic efficiency is improved due to the laminar flow effect. Additionally, the efficiency differences between the test results and the CFD analysis are almost identical.
2.3 Technology for enhancing the laminar flow area
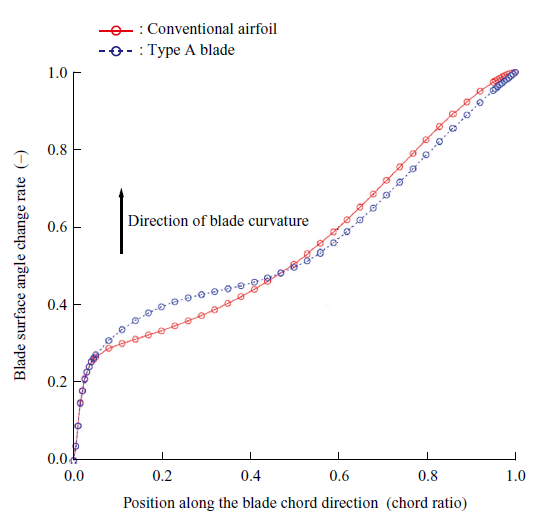
This chapter concludes by introducing the enhancement of the laminar flow area, which is one of the key technologies for further improving fan efficiency. Generally, at the tip of a low pressure ratio fan, the inflow Mach number exceeds 1, and the generation of strong shock waves leads to turbulent transition. On the other hand, shock waves are relatively weak near the mid-span, meaning that turbulent transition can be delayed if deceleration on the blade surface is controlled. In the case of a fan, the deceleration on the blade surface is determined by the position along the chord where the blade is curved and the degree of curvature (camber distribution). Figure 7 shows the concept of the camber distribution on the suction side of the blade to achieve laminar flow area enhancement(7). In the case of an enhanced laminar airfoil, the blade is curved near the 10% chord where deceleration does not cause turbulent transition, and the curvature is reduced downstream to lessen the deceleration.
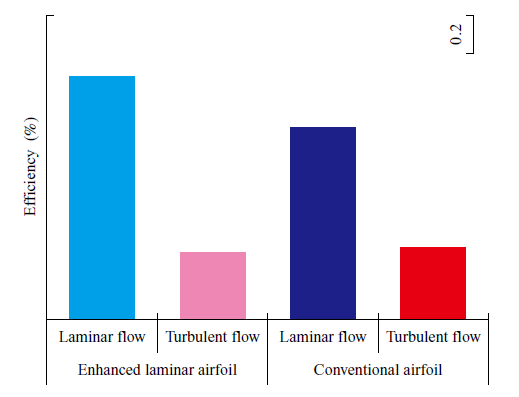
A fan with an enhanced laminar airfoil based on this concept was designed and tested using a rotary rig. Figure 8 shows the design point efficiency of the enhanced laminar airfoil and the conventional airfoil as obtained in the test. The bar chart shows, from left to right, the efficiency of the enhanced laminar airfoil without the tripping device, the enhanced laminar airfoil with the tripping device, the conventional airfoil without the tripping device, and the conventional airfoil with the tripping device. When comparing the enhanced laminar airfoil with the conventional airfoil, the efficiency in the turbulent flow state was similar, while the efficiency in the laminar flow state was higher for the enhanced laminar airfoil than for the conventional airfoil. Therefore, it is clear that expanding the laminar flow area contributed to the improvement in the efficiency of the enhanced laminar airfoil.
Future challenges include further reducing the SFC of the entire engine by exploring the application of laminar flow area enhancement technologies to regions other than the design point, as well as to other components such as the FEGVs.
3. Aeromechanics
Due to changes in structural and aerodynamic design conditions associated with reducing the pressure ratio, there is a possibility that new types of blade vibration, unlike those previously encountered, may emerge. Therefore, understanding these phenomena through testing and simulation, and establishing reliable prediction methods, will be key to successful development. This chapter introduces a case study in which CFD was used to predict blade vibration observed during an in-house test.
3.1 Blade vibration phenomena in low pressure ratio fans
Figure 9 summarizes the blade vibration phenomena experienced in aircraft engine fans in a schematic diagram. Figure 9-(a) is a fan aerodynamic performance map presented in terms of flow rate and pressure ratio. It shows the operating lines for high-altitude and ground conditions (in gray and blue, respectively) along with five constant-speed characteristic curves (in black). When the flow rate is reduced at any rotational speed, the fan experiences aerodynamic stall (in brown).
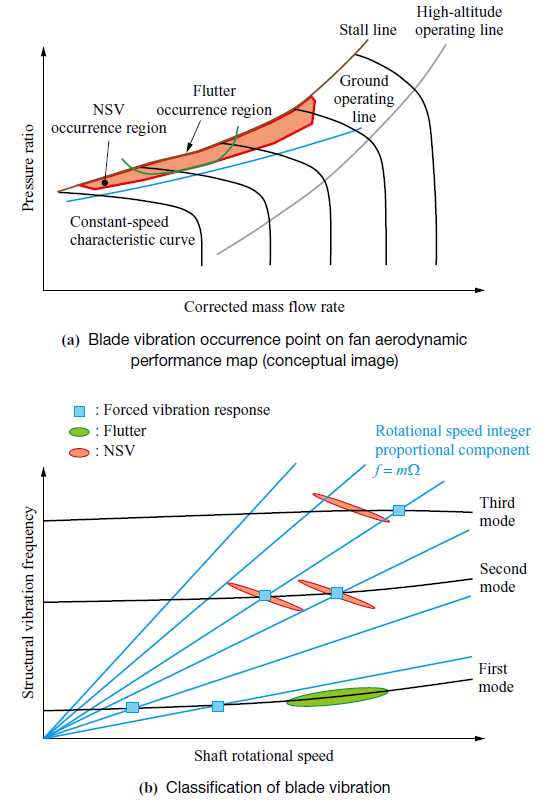
In ground operation, the ratio of the outlet static pressure to the inlet total pressure is higher than in high-altitude operation, causing the fan to operate under conditions close to stall. Under conditions with a higher flow rate than those at which stall occurs, phenomena such as flutter, which is self-excited vibration resulting from the interference between blade vibration and high-speed airflow, and non-synchronous vibration (NSV), which is associated with separated flow and acoustics, can occur. The occurrence points and regions are indicated in green and red, respectively. It is necessary to design the fans so that the regions where blade vibrations occur are sufficiently away from the operating lines, and to verify the design results.
Figure 9-(b) shows a Campbell diagram that plots the blade vibration mode frequencies and the excitation source frequencies, which are proportional to integer multiples of the rotational speed, against the rotational speed of the fan rotor. Flutter is likely to occur in lower-order vibration modes even in the absence of an excitation source. On the other hand, forced vibration response becomes apparent at resonance points where the frequency of the excitation force, caused by the non-uniformity of the flow, matches the frequency of a blade vibration mode. In addition to these two phenomena, NSV may occur regardless of whether it agrees with the resonance point. Therefore, this sort of vibration is classified based on a comprehensive assessment of the differences between flutter and forced vibration response, considering factors such as the occurrence trends on the performance map, vibration frequency, and the patterns of vibration modes.
3.2 Blade vibration observed in the test
During the fan test conducted by IHI, in addition to the flutter that was preliminarily anticipated in the blade first bending (1F) mode, NSV occurred in the blade second bending (2F) mode. Figure 10 shows the low pressure ratio fan tested and the shape of the 2F mode. The vibration amplitude distribution of the 2F mode obtained through structural analysis reveals that the maximum amplitude occurs at the leading edge of the blade tip. During the test, the performance map was obtained by varying the rotational speed and flow rate.
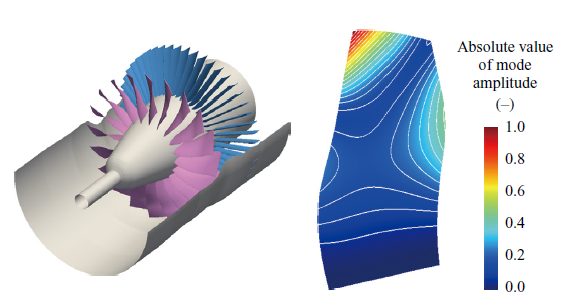
Figure 11 shows the obtained fan aerodynamic performance map. The red dashed line in the figure indicates the occurrence points of the 1F mode flutter at each rotational speed, while the blue dashed line indicates the occurrence points of the 2F mode NSV. When the 1F mode flutter occurs, the blade vibration rapidly reaches the allowable upper limit in the test. Therefore, the fan cannot be operated at flow rates below the point of 1F mode flutter occurrence. On the other hand, regarding the 2F mode NSV, there are cases where the blade amplitude rapidly increases, but the fan can still be operated at flow rates below the occurrence point in the case that the amplitude remains within the allowable range in the test. Additionally, at 77% rotational speed, a complex phenomenon was observed, with 1F mode flutter occurring immediately after the 2F mode NSV.
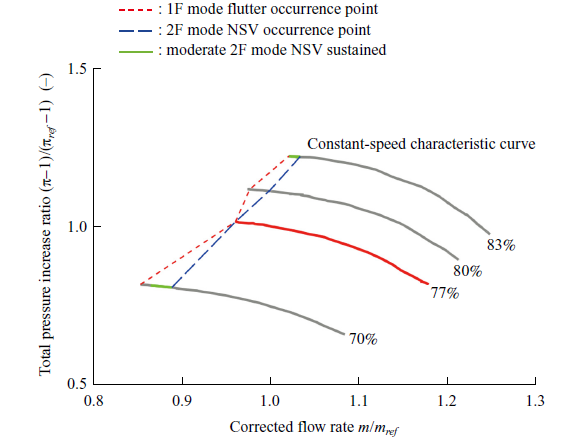
Conventionally, flutter generated in a fan has been considered to occur in the 1F mode. However, as seen in this case, there are instances where the 2F mode NSV occurs prior to the 1F mode flutter. Accordingly, as with 1F mode flutter, the prediction and avoidance of 2F mode NSV are considered important. IHI has been advancing efforts to understand and predict the phenomenon.
3.3 Assessment and prediction of the 2F mode NSV
This section introduces the assessment and prediction of the phenomenon on the tested fan focusing on the 77% rotational speed(8). The 2F mode NSV occurred at the low-flow operation point (normalized flow rate of 0.96) on the constant-speed characteristic curve. Forced vibration, with the same vibration pattern observed at the surrounding operation points during the test, was applied to the tested fan. The damping force due to pressure fluctuation (aerodynamic damping) was then evaluated through CFD analysis. For an overview of the numerical analysis and damping force evaluation method used, please refer to Reference(9).
Figure 12 shows the position of the 77% rotational speed on the fan aerodynamic performance map and the aerodynamic damping at each flow rate. In the figure, the pink color represents the steady and unsteady analysis results with no vibration applied to the blade, and it corresponds well with the trend of the gray marks representing the test results. Since the fan is operated very close to the aerodynamic stall point, the aerodynamic damping was evaluated by a transient simulation. The blue color represents the transient unsteady analysis results with vibration applied to the blade. In the transient simulation, as the inlet mass flow rate gradually decreased, the aerodynamic damping changed accordingly. During the test, the NSV occurred near a flow rate of 0.96, while the analysis showed that the aerodynamic damping became negative near a flow rate of 0.92, leading to destabilization (amplification) of blade vibration. Therefore, the flow rate at the point of unstable blade vibration occurrence was predicted with a difference of approximately 4%.
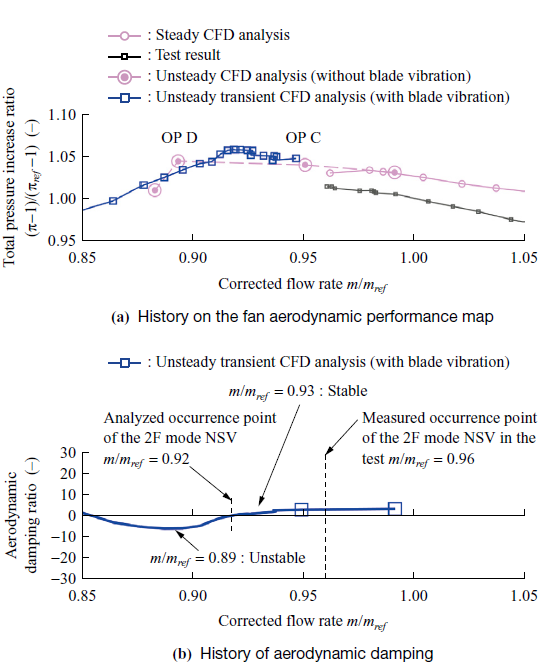
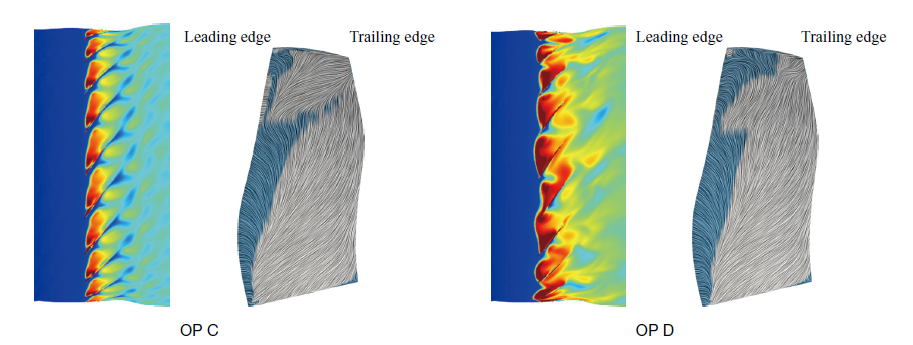
Figure 13 shows the entropy distribution at the blade tip and the limiting streamlines on the blade suction surface at operation point OP C with stable blade vibration and at operation point OP D with unstable blade vibration, based on CFD analysis results. The blue areas on the limiting streamlines correspond to the flow-reversal areas. High-entropy regions corresponding to separation vortex shedding are observed at the blade tips. Before and after the destabilization of blade vibration, the separation regions on the suction surface expand, and the shed vortices grow into larger structures, colliding with adjacent blades.
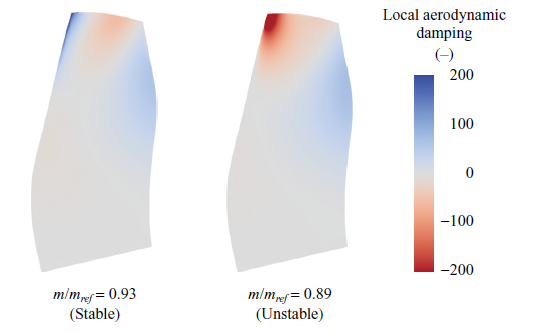
To examine the cause of the destabilization of blade vibration, Fig. 14 shows the distribution of the pressure fluctuation components acting as aerodynamic damping forces on the blade pressure surface. The blue region in the figure represents the damping force, while the red region represents the excitation force. As shown in Fig. 13, under these conditions, vortices flow to the adjacent blades as the flow rate decreases, and the vortices that flow over collide with the leading edges of the blade tips on the pressure surface. Figure 10 shows that the 2F mode has a mode shape in which the leading edge of the blade tip vibrates significantly. It is considered that vortices collide with this position at the same frequency as the blade vibration, resulting in a strong excitation force that destabilizes the 2F mode.
4. Noise
4.1 Fan noise
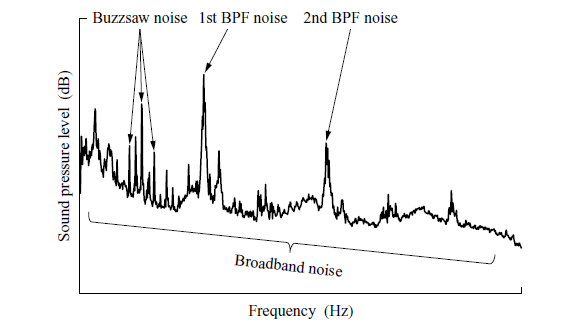
Fan noise originates from various types of sound sources. Figure 15 shows an example of the noise spectrum generated by a fan. It is known that there are blade passing frequency (BPF) components with a predominant specific frequency, buzzsaw noise (also called multiple pure tones) with rotational order components, and broadband noise that contains a variety of frequency components. The dominant BPF components in fan noise include: (1) noise from the stators due to the interference between the downstream flow of the rotors and the stators(10); (2) noise from the rotors due to the interference between a circumferentially nonuniform distortion flow in the circumferential direction and the rotors(11), (12); and (3) noise from the rotors themselves due to their rotation(13).
The fan elements include an intake at the front and a pylon (also called a bifurcation) at the rear, connecting the aircraft and the engine. Future engines are expected to have shorter intake/nacelle to reduce weight, which will result in larger distortion at the front of the fan due to the reduced diffusion length of the intake(14). Additionally, the shortening of the nacelle reduces the distance between the fan and the pylon, resulting in stronger distortion caused by the pylon. Furthermore, the increase in bypass ratio leads to a larger fan diameter, which results in increased engine weight, so the pylons supporting the engine might become larger. Additionally, the increased flow velocity due to the lower pressure ratios will further increase the distortion caused by the pylons. Therefore, the noise caused by the interference between distortion and the fan rotors was investigated through both tests and CFD analysis.
4.2 Fan noise tests
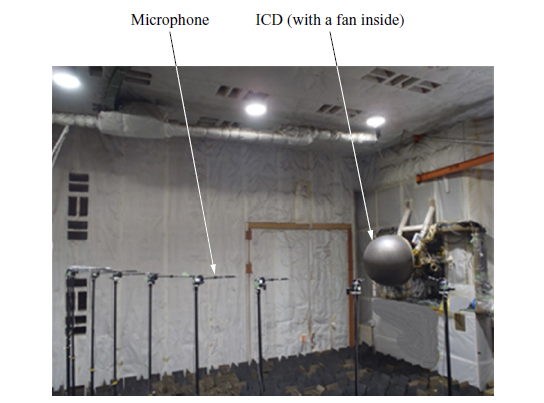
Figure 16 shows the fan test equipment installed in the anechoic wind tunnel (16 m in length, 10 m in width, and 8 m in height) at the Mizuho Aero-Engine Works of IHI, along with the microphone measurement setup in the far field. The inner walls of the anechoic wind tunnel are covered with sound-absorbing material. The fan was installed at a height of 3 m, and far-field noise was measured at the same height on the upstream side of the fan. Figure 17 shows the fan test equipment and an overview of the measurements. Upstream of the fan duct, a bell mouth and inflow control device (ICD) were installed. The ICD is installed to smooth the disturbed airflow from the ground and walls and to reduce the generation of unexpected noise.
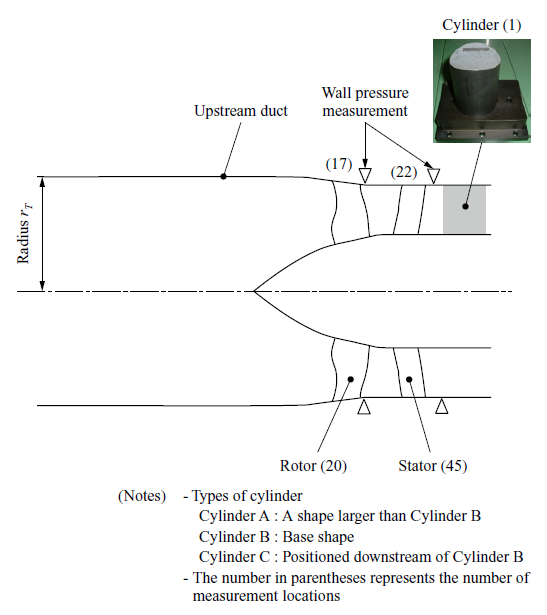
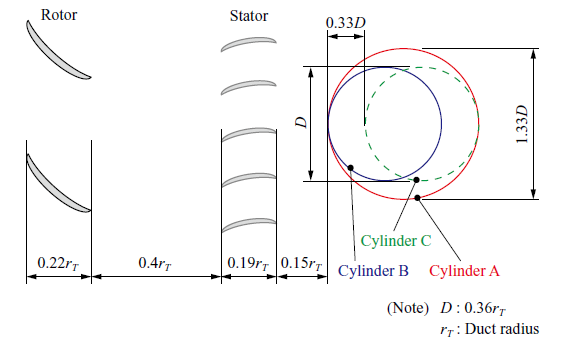
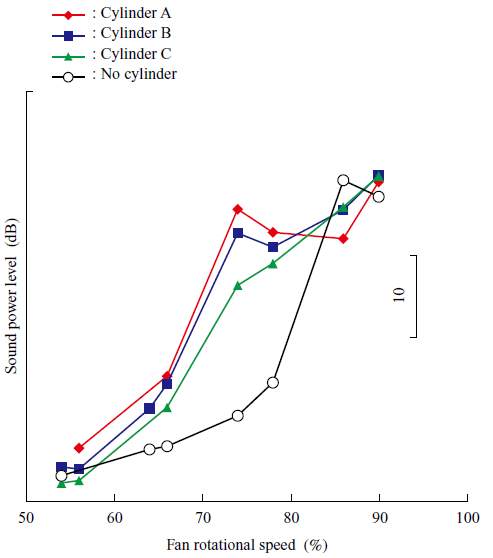
The relation between the distortion strength and noise was examined by varying the size and position of the cylinder simulating the pylon installed behind the fan. Figure 18 shows the configuration of the fan rotor and the cylinder in the rotor blade tip cross section. The noise measurements were conducted up to 90% of the design rotational speed. Figure 19 shows the sound power level of the 1st BPF(15) obtained from the measurement results in the far field. As shown in the figure, in the subsonic range, 54 to 66% of the design rotational speed, the effects of the presence or absence of cylinder and its shape are minimal. However, the sound power level slightly increased at 66% of the design rotational speed due to the presence of the cylinder. In the transonic range, 74 to 78% of the design rotational speed, the sound power level shows a significant difference depending on the presence or absence of the cylinder, with the sound power level increasing with the presence of the cylinder. The mechanism of the increase in sound power level is described in Section 4.3.
Additionally, the sound power level varies depending on the position and size of the cylinder. It can be seen that Cylinder A, with a larger diameter than Cylinder B, generates a higher sound power level, while Cylinder C, positioned downstream of Cylinder B, generates a lower sound power level. Therefore, these results indicate that the fan noise increases with the strength of distortion.
On the other hand, when the rotor blade tip circumferential speed exceeds supersonic speed, at 86% of the design rotational speed or higher, the sound power level is nearly the same regardless of the presence or type of the cylinder. This is because, in the supersonic range, the sound source from the rotor itself becomes predominant. Specifically, as the rotational speed increases, both the frequency and flow rate increase, resulting in the propagation of the sound mode (cut-on) inside the duct(16) and its subsequent radiation to the outside.
4.3 CFD analysis of fan noise
Figure 20 shows the distribution of the instantaneous static pressure obtained from the CFD analysis simulating a fan noise test. Comparing Fig. 20-(b) with the cylinder and -(c) without the cylinder, it can be seen that the distortion (static pressure potential field) generated by the cylinder downstream of the fan interacts with the fan blades, and noise to propagate the upstream of the fan rotor.
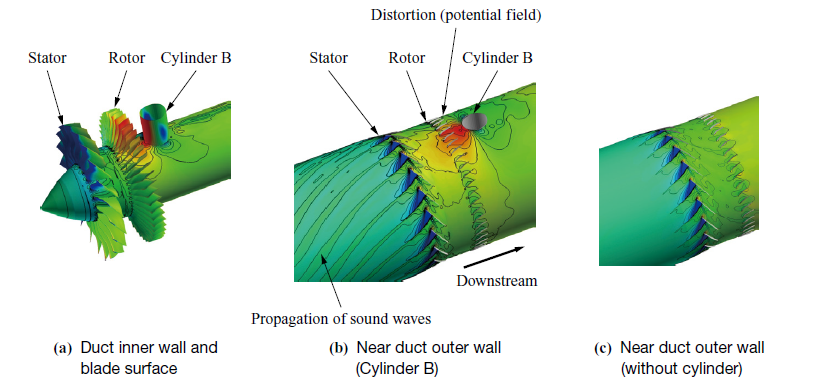
( Instantaneous static pressure )
Figures 21 and 22 show the experimental and CFD results of the distortion generated by the cylinder at 66% and 74% rotational speeds, respectively. The vertical axis represents the non-dimensional values obtained by dividing the static pressure (Ps) by the circumferential mean static pressure (Ps_ave) and subtracting 1 ((Ps/Ps_ave) −1). Comparing the non-dimensional values, it can be seen that the distortion at 74% rotational speed, which corresponds to a higher flow rate, is greater than at 66% rotational speed. Figure 21-(a) and Fig. 22-(a) show the static pressure distribution near the rotor, corresponding to the wall pressure measurement point in Fig. 17, while Fig. 21-(b) and Fig. 22-(b) show the static pressure distribution near the cylinder. From Figs. 21 and 22, it can be seen that the test results agree with the CFD analysis results, demonstrating that the CFD analysis simulates the test well. The interaction between the distortion and the rotor generates an unsteady aerodynamic loading on the blade surface, which results in noise generation from the blade surface. Specifically, the noise is generated because the rotating rotor passes through the distortion produced by the cylinder at the top position (0 degrees), as shown in Fig. 23. Figure 23-(b) shows the rotor viewed from the fan exit, where it can be seen that the static pressure is high on the top position. As a result, as the fan rotor completes one revolution, the top position, where the cylinder is located and the static pressure at the fan exit is high, undergoes a throttling operation with reduced suction flow. On the bottom side, where the static pressure at the fan exit is low, an opening operation occurs with increased suction flow. As a result, the static pressure distribution on the suction surface of the rotor blade (Fig. 23-(a)) differs depending on the circumferential position. Therefore, unsteady pressure fluctuation occurs on the blade surface due to its rotation.
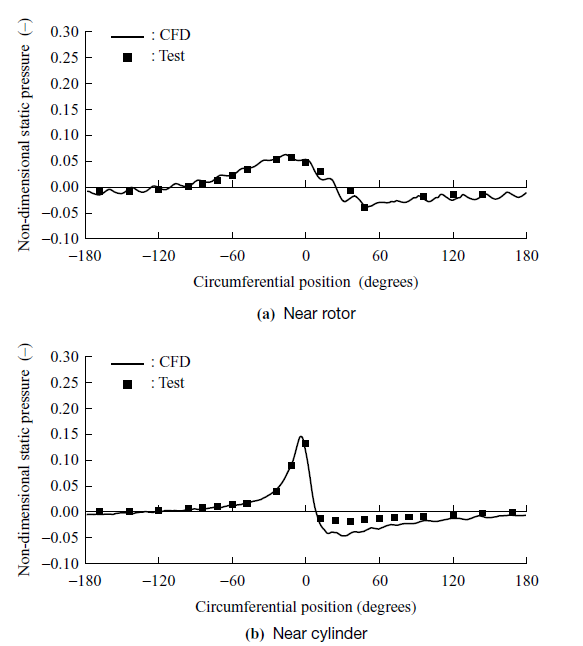
(66% speed)
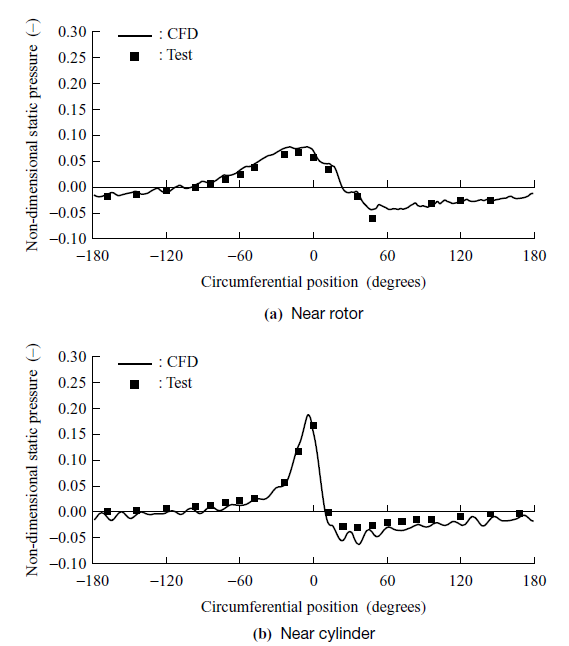
(74% speed)
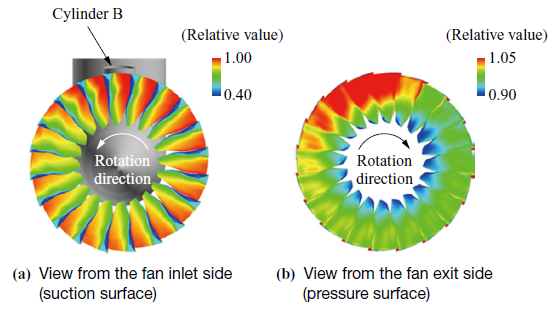
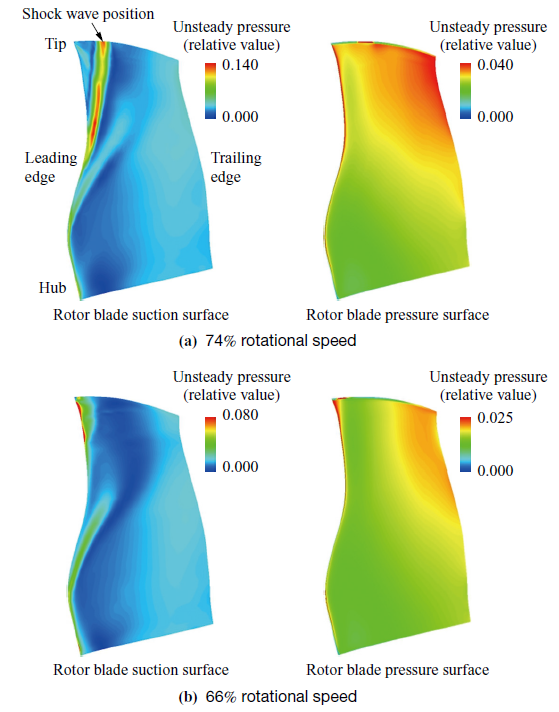
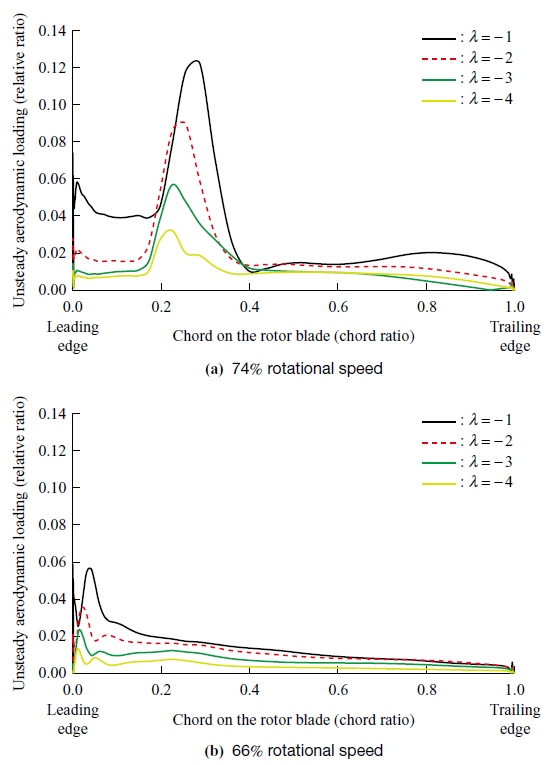
Figure 24 shows the unsteady pressure distribution on the blade surface resulting from one-time circumferential fluctuation during one rotor revolution, induced by the potential field (corresponding to λ = |1|, where λ is the circumferential harmonic number of the cylinder’s potential field). On the suction surface of the rotor blade, the unsteady pressure is high near the shock wave position at 74% rotational speed in the transonic range, and high at the leading edge at 66% rotational speed in the subsonic range. On the other hand, on the pressure surface, the unsteady pressure distribution is similar at both rotational speeds and corresponds to the relationship between the rotational speed and the strength of distortion (which increases with higher flow rates).
In lifting surface theory(17), the unsteady pressure difference between the pressure and suction surfaces, i.e., the unsteady aerodynamic loading, behaves as a dipole sound source distributed across the thin blade surface. Figure 25 shows the quantitative representation of the unsteady aerodynamic loading near the tip. As shown in the figure, the aerodynamic loading is large near the leading edge at 66% rotational speed in the subsonic range, and at the shock wave position (approximately 0.3 on the horizontal axis) at 74% rotational speed in the transonic range. Additionally, the values of the unsteady aerodynamic loading are higher at 74% rotational speed compared to 66% rotational speed. This is the main reason for the increase in sound power level at 74% rotational speed, as shown in Fig. 19. In this example, as shown in Fig. 25, the single fluctuation (λ = |1|) is large on the blade surface during one revolution due to the presence of a single cylinder in the circumferential direction.
From the above results, the noise tests and CFD analysis have clarified the fan noise generation mechanism in which the rotor interacts with the distortion, as well as the sound source locations on the rotor. Going forward, this knowledge will be applied to the design of low-noise fans.
5. Conclusion
This paper introduces the technological developments aimed at addressing the design challenges of civil engine fans, with higher bypass ratios and lower pressure ratios. Increasing the bypass ratio offers the benefit of reduced SFC, but it also presents the challenge of increased weight due to the larger fan diameter. To address this challenge, the application of composite materials as a lightweighting technology has been progressing. However, composite materials face challenges in ensuring impact resistance, as well as mitigating the effects of increased blade thickness on aerodynamic performance. Additionally, changes in the structural vibration characteristics and the environments around the blades, such as ducts and nacelles, also affect the aeromechanical and noise characteristics. In the future, we will focus on further advancing technologies in aerodynamics, aeromechanics, and noise to address these challenges.
- — Acknowledgments —
- Part of this study was conducted as part of the R&D activities of the “Environmentally Compatible Engine for Small Aircraft” project in the Civil Aircraft Fundamental Technology Program implemented by the Ministry of Economy, Trade and Industry, with the support of the New Energy and Industrial Technology Development Organization (NEDO). Additionally, we would like to express our profound gratitude to all the individuals at the Japan Aerospace Exploration Agency (JAXA) who granted permission for the use of the test equipment and the fluid analysis software, UPACS.
REFERENCES
(1) IHI : IHIing, < https://www.ihi.co.jp/ihiing/hot_topic/20240719-01.html >, accessed 2025-03-25
(2) R. Leipold, M. Boese and L. Fottner : The Influence of Technical Surface Roughness on the Flow Around a Highly Loaded Compressor Cascade, ASME 99-GT-366, 1999
(3) M. N. Goodhand and R. J. Miller : The Impact of Real Geometries on Three-Dimensional Separations in Compressors, ASME Paper GT2010-22246, 2010, pp. 129-138
(4) R. Hayashi, N. Tanaka, T. Enoki, T. Murooka, D. Kato, D. Masaki, J. Kazawa, S. Enomoto and T. Nishizawa : Experimental Study of Laminar Flow Effect for Transonic Engine Fan, Proceedings of the International Gas Turbine Congress, IGTC-2019-089, 2019
(5) F. R. Menter, R. B. Langtry, S. R. Likki, Y. B. Suzen, P. G. Huang and S. Völker : A Correlation-Based Transition Model Using Local Variables Part I — Model Formulation, ASME Paper GT2004-53452, 2004, pp. 57-67
(6) F. R. Menter : Two-Equation Eddy-Viscosity Turbulence Models for Engineering Applications, AIAA Journal, Vol. 32, No. 8, 1994, pp. 1,598-1,605
(7) R. Okada, R. Hayashi, T. Murooka and T. Enoki : Blade of Fan or Compressor, US11125085B2, 2019
(8) M. Aotsuka and T. Murooka : Numerical Analysis of Fan Transonic Stall Flutter, ASME Paper GT2014-26703, 2014
(9) A. Tateishi, M. Aotsuka, S. Kusuda, N. Tanaka, T. Enoki and T. Murooka : Aeroelastic assessment of the second flexure mode excitation in a low pressure ratio fan, Journal of the Global Power and Propulsion Society, Vol. 8, 2024, pp. 471-482
(10) S. Kusuda, N. Tsuchiya, H. Kodama and M. Namba : Prediction of Fan Tonal Noise at Far-field with Rotor-Stator Interaction Effect, Proceedings of International Symposium on Air Breathing Engines 2011, pp. 1,152-1,161
(11) S. Kusuda, N. Yamasaki, C. Inoue and M. Namba : Aircraft Engine Fan Tone Noise due to Back-Pressure Distortion Caused by a Downstream Pylon under High-Speed Conditions, Journal of Sound and Vibration, Vol. 572, 118163, 2024
(12) H. Naruse, T. Ishii, H. Oinuma, S. Kusuda, Y. Ooba, K. Hirakawa and H. Ishikawa : The Effect of Intake Length on Aerodynamic Characteristics under Inlet Distortion, Proceedings of 2020 International Congress on Noise Control Engineering, 2020, pp. 1,079-1,089
(13) M. J. T. Smith : Aircraft Noise, Cambridge University Press, 1989
(14) A. Peters, Z. S. Spakovszky, W. K. Lord and B. Rose : Ultrashort Nacelles for Low Fan Pressure Ratio Propulsors, Journal of Turbomachinery, Vol. 137, Iss. 2, 021001, 2015
(15) ISO 3745 : 2012 : Acoustics — Determination of Sound Power Levels and Sound Energy Levels of Noise Sources using Sound Pressure — Precision Methods for Anechoic rooms and Hemi-Anechoic Rooms, 2012
(16) J. M. Tyler and T. G. Sofrin : Axial Flow Compressor Noise Studies, SAE Transactions, Vol. 70, 1962, pp. 309-332
(17) M. Namba and J. Schulten : Category 4 Fan Stator with Harmonic Excitation by Rotor Wake, Third Computational Aeroacoustics (CAA) Workshop on Benchmark Problems, NASA/CP-2000-209790, M. D. Dahl, National Aeronautics and Space Administration, 2000, pp. 73-86