
Synthetic Data Generation Techniques for Visual Inspection AI Models
OSHIMA Takahisa, MIZUYAMA Yoshino, KITAMURA Shunya
OSHIMA Takahisa : Manager, Advanced Manufacturing Process Department, Technology Platform Center, Corporate Research & Development Division
MIZUYAMA Yoshino : Advanced Manufacturing Process Department, Technology Platform Center, Corporate Research & Development Division
KITAMURA Shunya : Advanced Manufacturing Process Department, Technology Platform Center, Corporate Research & Development Division
In the automation of visual inspection in the manufacturing industry, the difficulty of collecting defective product data has been a significant challenge. Recently, the use of synthetic data, which involves the artificial generation of images of defective products, has gained attention as a method to ensure a sufficient volume of data. In this study, synthetic data simulating defective metal components was generated using multiple approaches, including image processing and optical simulation. Furthermore, the usefulness of synthetic data as training data was verified by constructing an AI inspection model trained exclusively on synthetic data.
1. Introduction
Automating the visual inspection of industrial products remains a challenge throughout the manufacturing industry, and its realization is highly anticipated. Attempts to solve this issue by using cameras and developing image recognition AI models are becoming increasingly prevalent. However, collecting images of defective products for training and validation poses difficulties due to the low defect occurrence rate and the inability to cover all defect patterns. Although methods exist to build inspection models using only images of non-defective products, they tend to produce a high false positive rate. As a result, operating procedures require frequent double-checking by human inspectors, and often, the costs outweigh the benefits of AI implementation.
Researchers are increasingly turning to artificially generated image data as one potential solution. This data is created through computation instead of relying on actual defective product images and is used to train and validate AI models. Artificially generated image data, known as synthetic data, has already been utilized in the automotive industry to simulate road scenarios for training and validating autonomous driving algorithms. Similarly, in the manufacturing industry, there are growing expectations that the automation of visual inspection will be achieved by utilizing synthetic data that simulates images of defective products. Several services now offer generative algorithms for this purpose.
International standards have also begun to reference synthetic data. For example, ASTM E3327(1), a guideline for building semi-automated defect detection models using digital-radiographic testing (D-RT) images in non-destructive inspection, recommends using synthetic data in addition to real data. This is due to the practical difficulty of covering all defect patterns in actual manufacturing processes.
The cost of creating synthetic data for defective product images varies significantly depending on the inspection target and inspection method (photography method). Current generation methods fall into three categories: image processing, optical simulation (3D-CG), and generative AI. This paper introduces each generation method, including specific examples IHI has explored, and presents the evaluation results of synthetic data as training data.
2. Generation method by image processing
The least expensive method of generating synthetic data of defective products is to edit and process regions within images of non-defective products to have simulated defective regions. In many cases, simulated defective regions are created by cropping sections from real defective product images or by using image editing software. However, this generation method works well only when the imaging targets and conditions are simple. Specific examples include inspection images captured by scanning wall surfaces or pipe interiors with a camera, or images obtained through non-destructive inspection techniques such as ultrasonic, infrared, or X-ray. These methods handle flat, two-dimensional images without depth, enabling low-cost generation of high-quality synthetic defect data through image processing alone.
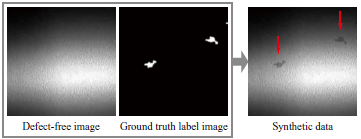
Figure 1 shows an example of generating synthetic data by applying image processing to a photo of a defect-free inner surface of a cylindrical metal pipe mock-up and adding simulated local wall thinning defect caused by corrosion. This example took advantage of the fact that the shape of corrosion-induced thinning can be approximated using a cellular automaton and the program was used to simulate the shadow cast by the thinned part when lit by editing pixel values.
3. Generation method by optical simulation
In many cases, generating plausible synthetic defect data using only image processing proves difficult in practice. Such difficulties typically arise when inspection targets have complex 3D shapes, the lighting configuration is complicated, or the target surface exhibits anisotropic optical properties. Since generating this type of synthetic data requires physical simulation of light rays entering the camera, the process typically uses 3D-CG or a method known as physically based rendering(2). For example, in the field of visual question answering (VQA) which focuses on generating captions based on input images, the CLEVR(3) project releases a dataset composed entirely of synthetic data generated using 3D-CG.
3.1 Example of defect introduction on simulated blade
Assuming a simulated blade as the inspection target, we present a method for generating synthetic data by rendering 3D-CG images that simulate photographic images, along with examples of the output. A 3D-CAD model with local surface indentations was used to represent defects. Three types of defects were assumed having a depth of approximately 50 μm: a dent in the form of indentation, a scratch resembling an elongated gouge, and a nick in the form of a small chip or notch. Figure 2 shows a shooting scene created in virtual space using Blender Ver. 4.0, where a 3D model of a simulated blade was created, and cameras and lights were arranged. Since the objective was to detect indentations, we simulated the defects by displacing each vertex of the inspection target model’s mesh from its original position.
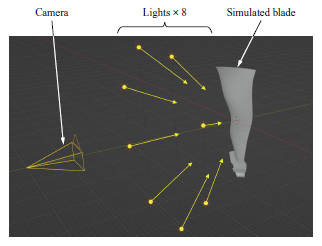
Because the photometric stereo method(4) was adopted as the imaging technique, multiple light sources were arranged with different illumination directions. The photometric stereo method can estimate an object’s surface normal by analyzing a set of images captured for each illumination pattern and output the result as a normal map. Height maps and curvature maps can also be calculated from a normal map, making it a commonly used imaging technique for emphasizing local surface irregularities on inspection targets.
When using 3D-CG to approximate real photographic images, it is crucial to reproduce the real surface’s optical properties (physical properties such as reflection, scattering, transmission, and absorption) with high fidelity. As will be discussed in Section 3.2, measuring these surface optical properties generally incurs significant cost. However, since the normal map in the photometric stereo method focuses on the object’s shape, it can provide the advantage of obtaining results similar to real photographic images, even without fully replicating surface optical properties.
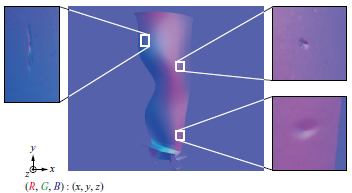
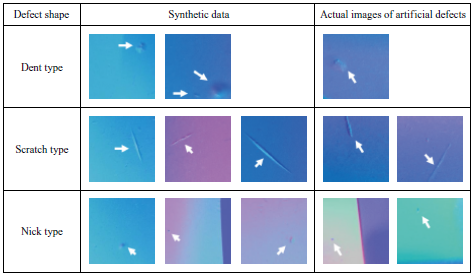
Figure 3 shows an example of synthetic data (normal map) and indentation areas generated by 3D-CG. Since this is a normal map, the image’s RGB values correspond to the x, y, and z components of the object’s surface normal. In visual inspection, pass/fail decisions for surface irregularities are often based not only on their areal extent across the surface, but also on their maximum depth or height relative to the surface. 3D-CG allows us to control defect characteristics by treating these numerical values as hyperparameters. By randomly varying the defects’ shape, area, and maximum depth, we created a synthetic dataset with diverse defect patterns. Figure 4 shows examples of cropped patch images (200 × 200 pixels) from the synthetic dataset we generated. For reference, the right side of Fig. 4 shows images of non-defective inspection samples to which artificial defects were applied, simulating actual defect shapes found in the process.
3.2 Methods of acquiring and defining surface optical properties
Section 3.1 demonstrated how the photometric stereo method enabled synthetic image generation that resembled real images, even without faithfully replicating surface optical properties. However, few real-world inspections involving imaging techniques such as pattern projection and multispectral cameras allow the surface’s optical properties to be disregarded. To faithfully reproduce images obtained by photography methods other than the photometric stereo method and utilize synthetic data, the process must define the target’s surface optical properties. The following section introduces several methods of acquiring and defining those properties.
3.2.1 Definition via shader parameter adjustment
3D-CG software provides several shaders, which are mathematical procedures describing how light interacts with object surfaces. Users can define optical properties by adjusting parameters such as reflectance and surface roughness. The relevant shader in Blender, as used in this study, is the Principled BSDF(5). Typically, designers manually fine-tune parameters within the software to replicate real-world appearances, but this process is time-consuming and requires expertise. To address this issue, one possible approach is to use real photographs taken under various imaging conditions as reference targets. The shader parameters of 3D-CG rendered images generated under the same conditions are then optimized to minimize errors based on arbitrary evaluation metrics.
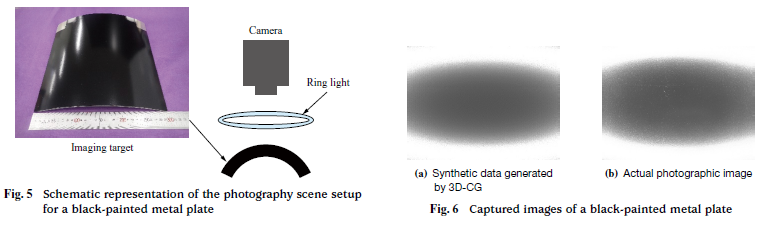
Here we introduce an example applying this setting method to a black-painted bent metal plate. Figure 5 shows a schematic representation of the photography scene setup. A similar imaging setup was reproduced in the 3D-CG environment, and the shader parameters were adjusted through optimization calculation to maximize the similarity between the rendered image and the real photographic image. Figure 6 shows a comparison between a rendered image after optimization and a real photographic image. When the surface texture or geometry of the inspection target makes obtaining optical properties difficult, a simplified parameter adjustment method like this allows simulation of those optical properties.
3.2.2 Definition via texture images
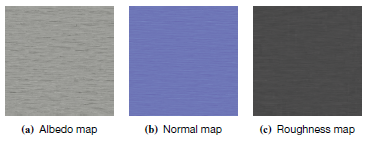
Material images known as physically based rendering (PBR) textures, which reflect surface optical properties, can be applied to the shader parameters described in Subsection 3.2.1. Applying texture images enables the reproduction of surface patterns and fine surface irregularities corresponding to roughness levels, resulting in more realistic rendering. Typical examples include albedo maps for color, normal maps or bump maps for micro surface irregularities, and roughness maps for surface roughness.
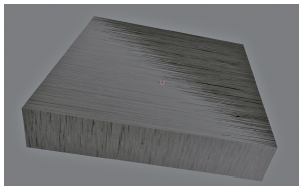
Acquiring PBR textures generally requires a studio setup to photograph parts of an actual inspection object’s flat surface from multiple lighting directions; fortunately, various commercial services offer this type of photography. Figure 7 shows the texture images generated for a metallic roughness test piece (Ra = 1.6 μm). Figure 8 shows the rendered 3D-CG appearance after applying the texture images to a rectangular solid surface, where linear roughness is visibly represented.
3.2.3 Definition via BRDF measurement results
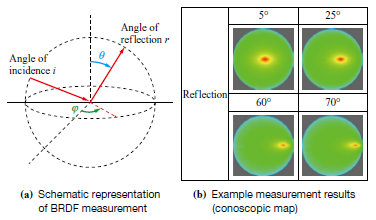
A method that results in more accurate reproduction of light reflection in 3D-CG is bidirectional reflectance distribution function (BRDF)(6), which quantitatively measures surface reflectance relative to the directions of incident light and observed light on the object surface. Figure 9 shows a schematic representation of BRDF measurement and example results at fixed incident angles of 5°, 25°, 60°, and 70°. A continuous function model derived from discrete BRDF measurements is applied to the simulated inspection surface. This method ensures high fidelity, as it is based on actual optical property measurements of the inspection target. However, it requires specialized measurement equipment and optical simulation software, resulting in high cost.
3.2.4 Comparative evaluation of surface optical property definition methods
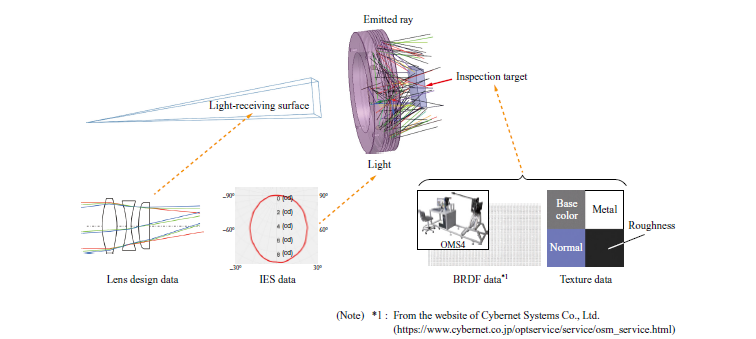
We used Speos (ANSYS, USA), an optical simulation software capable of applying BRDF measurement results to models, to conduct a comparative evaluation between the texture image method introduced in Subsection 3.2.2 and the BRDF measurement method introduced in Subsection 3.2.3. Figure 10 shows a schematic representation of the configuration in Speos, and Fig. 11 presents rendered images of flat test specimens whose surface optical properties have been defined by each method. Figure 10 illustrates that the simulation can reproduce actual imaging environments using lens design data and Illuminating Engineering Society (IES) data. It is also possible to define both texture and BRDF properties simultaneously. This was done with the expectation that their combination would enable the reproduction of fine surface irregularities observed on real surfaces with similar reflectance characteristics.
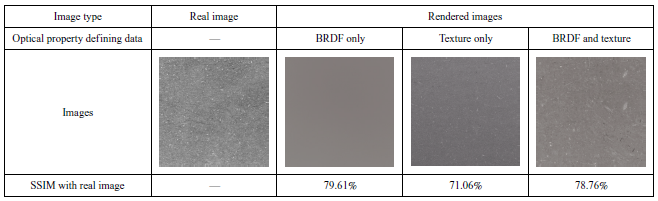
The evaluation used structural similarity index (SSIM)(7), a common indicator of image similarity, as the similarity metric. SSIM values of the real and generated images appear below each image in Fig. 11. The simulation image generated using only BRDF data showed a higher similarity score than the image using only texture data, confirming more accurate reproduction of surface reflectance characteristics through BRDF-based settings. The image applying only BRDF measurement results (second column from the left in Fig. 11) shows slightly higher similarity than the image applying both BRDF measurement results and texture images (fourth column from the left in Fig. 11). This difference might have been caused by a misalignment between the surface when it was scanned for the texture image and the real image’s captured area. SSIM, an evaluation indicator, comprises comparison terms for luminance, contrast, and structure to calculate evaluation values for each local region, then averages those scores. Therefore, misalignment of minute surface irregularities may lower the scores in each region, potentially causing the overall image evaluation value to be lower than the perceived visual similarity. The evaluation revealed that establishing an appropriate metric for accurately assessing generated images remains an issue.
4. Generation method using generative AI (diffusion models)
When there is a need to generate complex synthetic defect data that is difficult to model with 3D-CG, fine-tuning of diffusion models(8), commonly referred to as image-generating AI, can potentially generate such data.
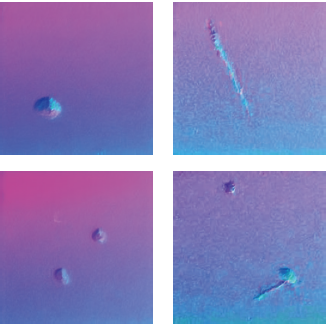
Figure 12 shows an example of synthetic normal map data generated by a diffusion model, using photometric stereo photography of local surface indentations such as nicks and scratches. The fine-tuning process applied a method called DreamBooth(10) to the Stable Diffusion v1.4(9) model, using 20 real defect images as training data. It should be noted that, since this method does not necessarily generate synthetic data representing actual defects, each output must be visually classified by a domain expert who can determine whether it is a defect or not, resulting in annotation costs. Also, the generation method’s theoretical basis involves probabilistic processes, so controlling defect characteristics as precisely as in 3D-CG is not feasible. Though there are several points to note when using this method, this method is a promising option for synthetic data generation, as the underlying technology is advancing rapidly.
5. Evaluation of synthetic data effectiveness
To verify the effectiveness of synthetic data created with 3D-CG, we evaluated the detection rate when an image recognition AI (deep learning model) trained solely on synthetic data was used to perform inference on actual defect images as test data. For simplification, the deep learning model used MobileNetV2(11), a simple image classification model. The model was trained using 200 × 200 pixels patch images cropped from the synthetic data, as shown in Fig. 4. The task was framed as a binary classification problem to distinguish between OK (non-defective) and NG (defective) patches.
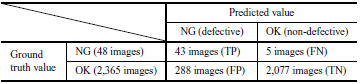
Table 1 shows a confusion matrix that summarizes the relationship between the test data predictions and their ground truth classes. The true positive rate (TPR), calculated as TP/(TP + FN), was 89.6%. The false positive rate (FPR), calculated as FP/(FP + TN), was 12.2%. The Precision, calculated as TP/(TP + FP), was 13.0%, resulting in a high false detection rate of 87.0%. However, these performance values have room for improvement because inspection models typically employ more complex network models and incorporate real captured data during training.
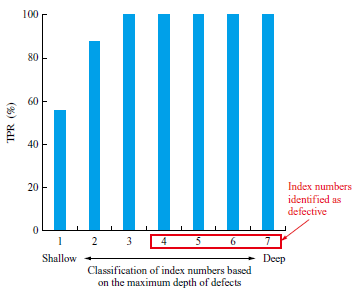
Also, the maximum depth of the introduced indentation defects was used to classify defect severity, and index numbers were assigned in order of depth. Figure 13 shows the TPR for each index number, revealing that missed detections occurred primarily with defects of shallower maximum depth. Since the inspection target is defined to treat defects with a maximum depth of index number 4 or higher as actual defects, the prepared test data achieved a 100% detection rate, confirming the effectiveness of 3D-CG generated synthetic data as training data for inspection models.
While this evaluation focused on assessing the usefulness of synthetic data as training material, evaluation metrics for synthetic data are still under development, with various indicators being proposed. For example, methods to assess the statistical similarity between synthetic and real images include: Frechet inception distance (FID)(12), which evaluates differences in feature distributions; inspection score (IS)(13) for evaluating synthetic data diversity; and SSIM adopted in Subsection 3.2.4, for evaluating structural similarity. Furthermore, methods like train on synthetic, test on real (TSTR) and train on real, test on synthetic (TRTS)(14) are available for evaluating data discriminability. The evaluation adopted in this study corresponds to the TSTR approach.
Since no standardized evaluation metrics for synthetic data have been established, appropriate metrics must be selected based on the characteristics of the data and the purpose of the evaluation.
6. Conclusion
This paper has presented three specific synthetic data generation techniques — image processing, optical simulation (3D-CG), and generative AI — for use in automating visual inspection with AI-based models. For optical simulation in particular, the evaluation of synthetic data was conducted by constructing an inspection classification model trained exclusively on synthetic data and performing inference on unseen real images. The model successfully classified non-defective and defective products with a TPR of 89.6% and an FPR of 12.2%, confirming the validity of synthetic data for training purposes.
Other potential applications include using synthetic data for validation or as source data for transfer learning in inspection models. Future applications of synthetic data include validating performance and ensuring the quality of visual inspection AI models implemented in production lines. These efforts also involve examining evaluation metrics for inspection images. Planned activities also include developing engineering tools for optical system design to support the introduction of new visual inspection equipment.
REFERENCES
(1) ASTM E3327/E3327M-21 : Standard Guide for the Qualification and Control of the Assisted Defect Recognition of Digital Radiographic Test Data, 2021
(2) B. Burley : Physically Based Shading at Disney, ACM SIGGRAPH, 2012, pp. 1-7
(3) J. Johnson, B. Hariharan, L. Maaten, F. Li, L. Zitnick and R. Girshick : CLEVR: A Diagnostic Dataset for Compositional Language and Elementary Visual Reasoning, Proceedings of IEEE Conference on Computer Vision and Pattern Recognition (CVPR), 2017
(4) H. Imoto, K. Machida, Y. Yamaura, H. Tadenuma, and T. Maekawa : Development of Microscopic Shape Measuring System Using Iterative Photometric Stereo Techniques, Transactions of the Japan Society of Mechanical Engineers, Vol. 82, No. 835, 2016 (in Japanese)
(5) B. Burley : Extending the Disney BRDF to a BSDF with Integrated Subsurface Scattering, ACM SIGGRAPH, 2015
(6) C. Schlick : An Inexpensive BRDF Model for Physically-based Rendering, Computer Graphics Forum, Vol. 13, No. 3, 1994
(7) Z. Wang, A. C. Bovik, H. R. Sheikh and E. P. Simoncelli : Image Quality Assessment: From Error Visibility to Structural Similarity, IEEE Transactions on Image Processing, Vol. 13, Iss. 4, 2004, pp. 600-612
(8) R. Rombach, A. Blattmann, D. Lorenz, P. Esser and B. Ommer : High-resolution Image Synthesis with Latent Diffusion Models, Proceedings of the IEEE/CVF Conference on Computer Vision and Pattern Recognition (CVPR), 2022, pp. 10,684-10,695
(9) Stability AI:https://huggingface.co/CompVis/stable-diffusion-v1-4, accessed 2022-08-20
(10) N. Ruiz, Y. Li, V. Jampani, Y. Pritch, M. Rubinstein and K. Aberman : DreamBooth: Fine Tuning Text-to-Image Diffusion Models for Subject-Driven Generation, Proceedings of the IEEE/CVF Conference on Computer Vision and Pattern Recognition (CVPR), 2023, pp. 22,500-22,510
(11) M. Sandler, A. Howard, M. Zhu, A. Zhmoginov and L. Chen : Mobilenetv2: Inverted Residuals and Linear Bottlenecks, Proceedings of the IEEE Conference on Computer Vision and Pattern Recognition (CVPR), 2018, pp. 4,510-4,520
(12) M. Heusel, H. Ramsauer, T. Unterthiner, B. Nessler and S. Hochreiter : GANs Trained by a Two Time-Scale Update Rule Converge to a Local Nash Equilibrium, Advances in Neural Information Processing Systems 30 (NIPS 2017), 2017
(13) T. Salimans, I. Goodfellow, W. Zaremba, V. Cheung, A. Radford and X. Chen : Improved Techniques for Training GANs, Advances in Neural Information Processing Systems 29 (NIPS 2016), 2016
(14) L. Xu, M. Skoularidou, A. Cuesta-Infante and K. Veeramachaneni : Modeling Tabular Data Using Conditional GAN, Advances in Neural Information Processing Systems 32 (NeurIPS 2019), 2019